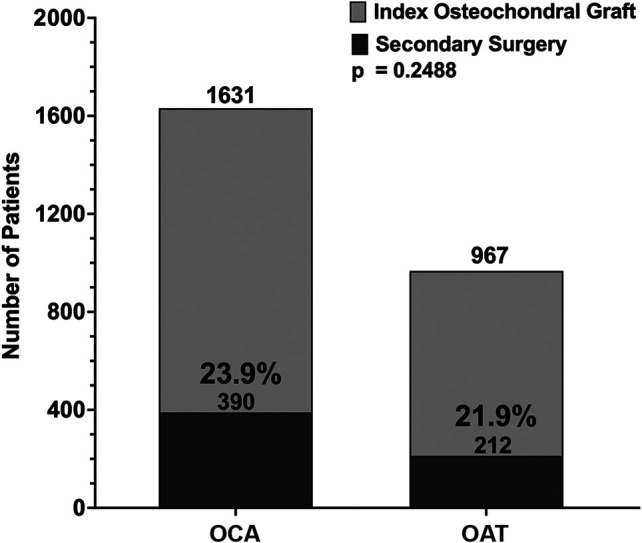
Figure 2.

Comparison of secondary surgery rates in patients undergoing osteochondral allograft transplant (OCA) versus osteochondral autograft transfer (OAT). We found no statistical difference in the secondary surgery rate when comparing OCA and OAT cohorts (P = .249).
