Figure 1.
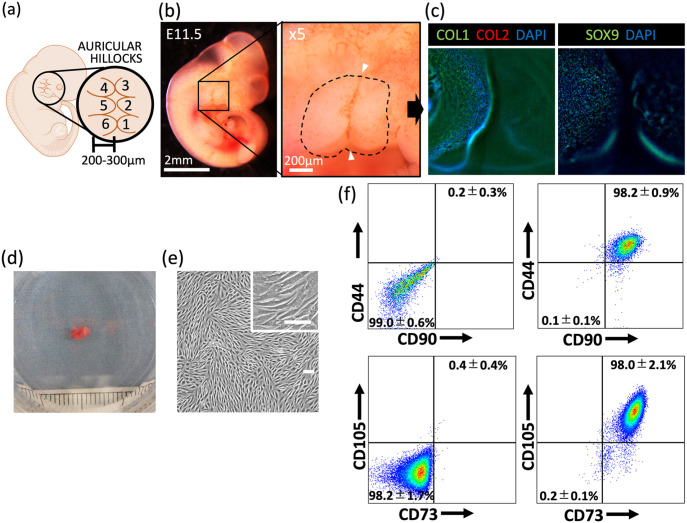
Analysis of fetal auricular hillocks and human perichondrial chondroprogenitor cells. (a) Schematic representation of a human embryo at 6 weeks gestation, showing the emerging auricular hillocks. (b) Image of the auricular hillocks of an E11.5 mouse embryo, with a magnified view shown on the right. Dashed line indicates the outline of the hillocks. White arrowheads indicate the first pharyngeal groove. (c) Immunohistochemistry of E11.5 mouse embryonic auricular hillocks. Left panel: type I collagen (COL1) (green), type II collagen (COL2) (red), and diamidino-phenylindole (DAPI) (blue) staining; right panel: SOX9 and DAPI staining. (d) Image of an excised auricular perichondrium (scale: 1 mm). (e) Image of expanded auricular perichondrial chondroprogenitor cells (scale bars: 100 μm). (f) Representative flow cytometry analysis of perichondrial cells to determine CD44, CD90, CD73, and CD105 expression in four patient samples. Left panels: unstained cells (negative control). Data are shown as the mean ± SD.

