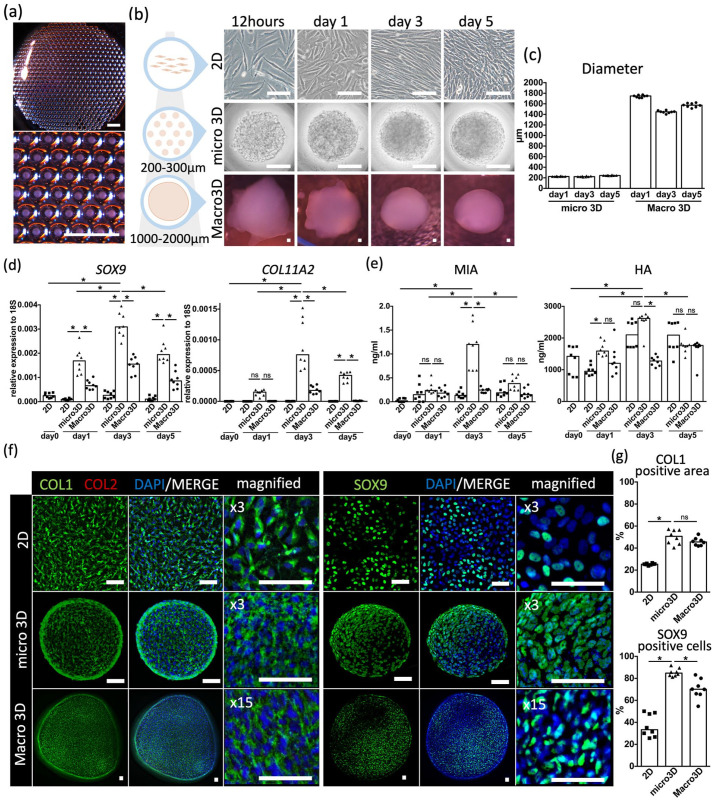
Figure 2.
Comparison of 2D, micro 3D, and macro 3D cultures. (a) Image of micro 3D culture with a magnified panel below. Scale bars: 2 mm. (b) Time course images of 2D (top row), micro 3D (middle row), and macro 3D (bottom row) cultures. Scale bars: 100 μm. (c) Diameter of micro 3D and macro 3D spheroids. (d) Gene expression of SOX9 and COLL11A2 against 18S in each culture system on a time course. (e) Secretion level of melanoma inhibitory activity (MIA) and hyaluronic acid (HA) in each culture system on a time course. (f) Merged and magnified immunohistochemical images of 2D (top row), micro 3D (middle row), and macro 3D (bottom row) cultures after staining with type I collagen (COL1) (green), type II collagen (COL2) (red) (left panels), and SOX9 (green) (right panels), along with diamidino-phenylindole (DAPI) (blue). Scale bars: 50 μm. (g) Areas positive for COL1 staining (%) and cells positive for SOX9 staining (%) based on immunohistochemical images of each culture system. Data are shown from eight independent experiments.
ns: not significant.
*p < 0.01.

