
Figure 3.
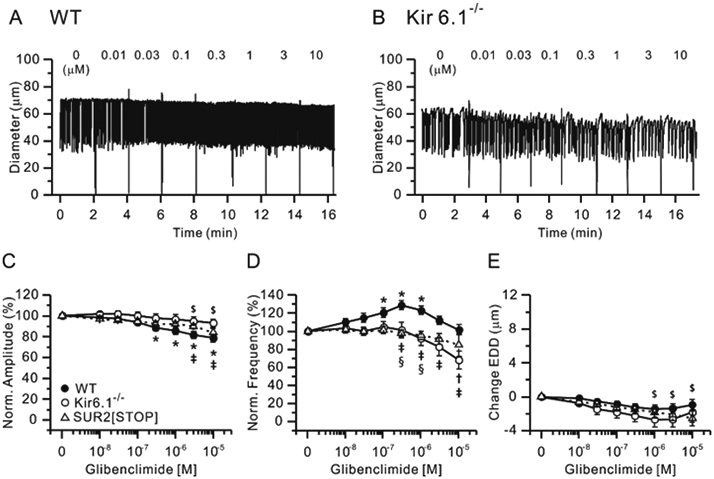
Effects of glibenclamide (GLIB). Representative recordings showing concentration-dependent effects of the KATP channel antagonist GLIB on the spontaneous contractions of WT (A) and Kir6.1−/− (B) mouse popliteal lymphatics. Normalized amplitude (C), normalized frequency (D) and change in EDD (E) plotted as a function of GLIB concentration, from 10 nM to 10 μM. Filled circles indicate WT vessels (n=22), open circles indicate Kir6.1−/− vessels (n=10) and open triangles indicate SUR2[STOP] vessels (n=14). All data are means ± SEM. * Significant difference in WT data from control (in the absence of GLIB). $ Significant difference in SUR2[STOP] data from control. † Significant difference in Kir6.1−/− data from control (none). ǂ Significant difference between WT and Kir6.1−/− data. § Significant difference between WT and SUR2[STOP] data.