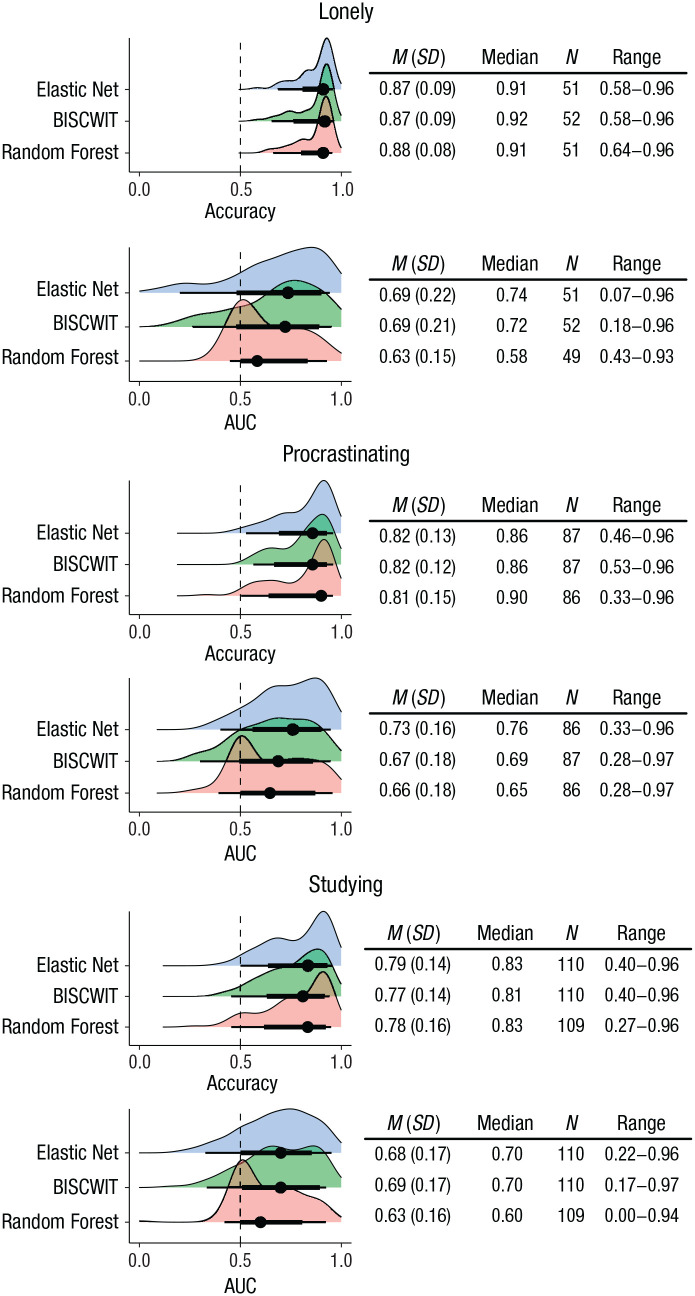
Fig. 1.
Histograms showing classification accuracy and area under the receiver-operating-characteristic curve (AUC) for the best-performing models predicting loneliness, procrastinating, and studying. For each outcome, distributions from three models are shown: elastic net; best-items scale that is cross-validated, correlation-weighted, informative, and transparent (BISCWIT); and random forest. Shaded regions indicate the density of the data, dots represent medians, wide lines represent 66% confidence intervals, and thin lines represent 95% confidence intervals. AUC = area under the receiver-operating-characteristic curve.

