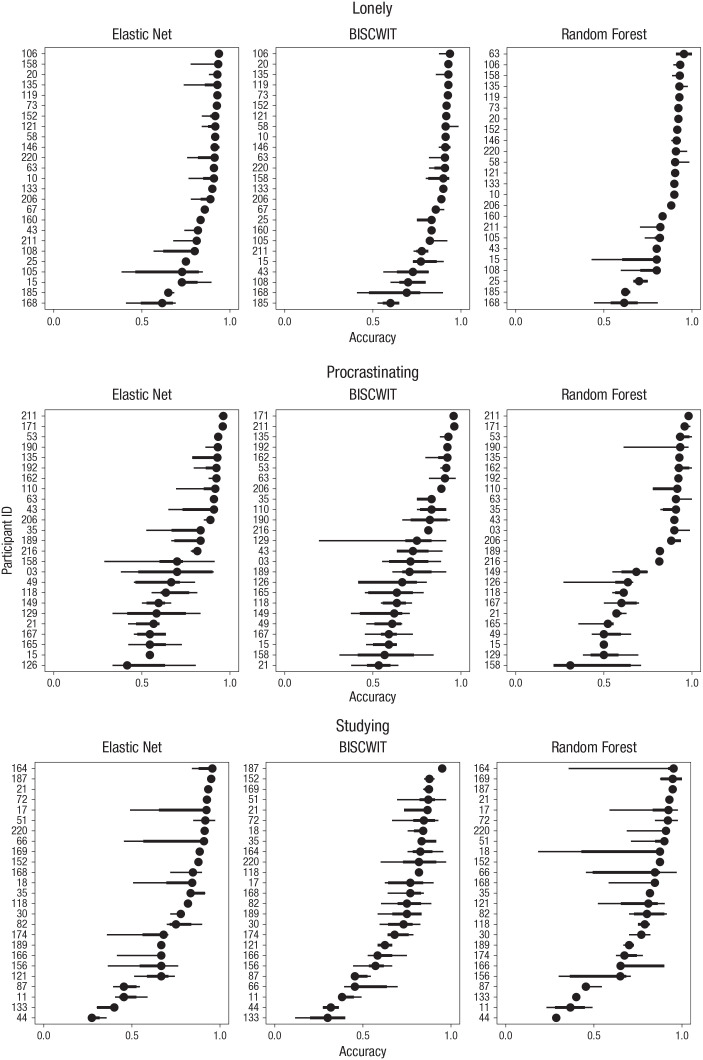
Fig. 2.
Person-level distributions of classification accuracy for 25 randomly selected sample participants, separately for classifiers predicting loneliness, procrastinating, and studying. Dots represent medians, wide lines represent 66% quantiles, and thin lines represent 95% quantiles. BISCWIT = best-items scale that is cross-validated, correlation-weighted, informative, and transparent.

