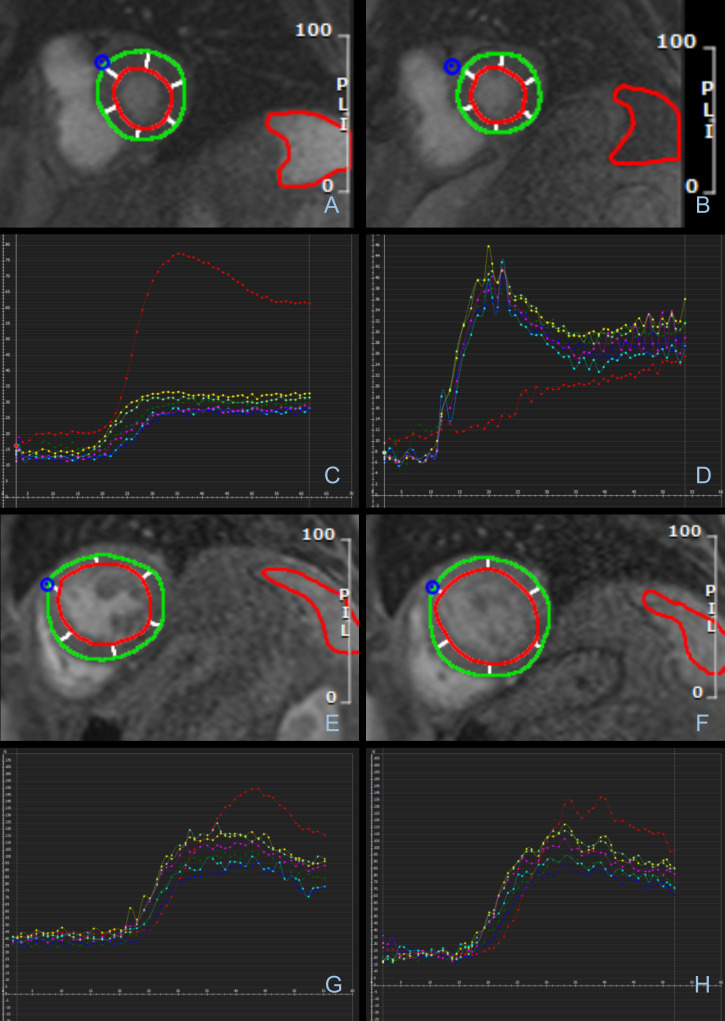
Figure 2.
Splenic Switch-Off on Stress CMR. (A-D) Stress CMR images showing splenic switch-off in a 75-year-old male in sinus rhythm. Splenic signal intensity (SI) is clearly visually reduced at stress. This is confirmed in the corresponding graphical representation of tissue SI against time. Red line indicates splenic SI. Other lines each represent SI of a myocardial segment. (A) Rest image B) Stress image C) Rest graph D) Stress graph. (E-F) Stress CMR images showing failed splenic-switch off in a 68-year-old male with AF. (E) Rest maximum splenic SI F) Stress maximum splenic SI. (G-H) Graphical representation of tissue perfusion on stress CMR showing failed splenic switch-off in a 72-year-old male with AF. (G) Rest H) Stress.

