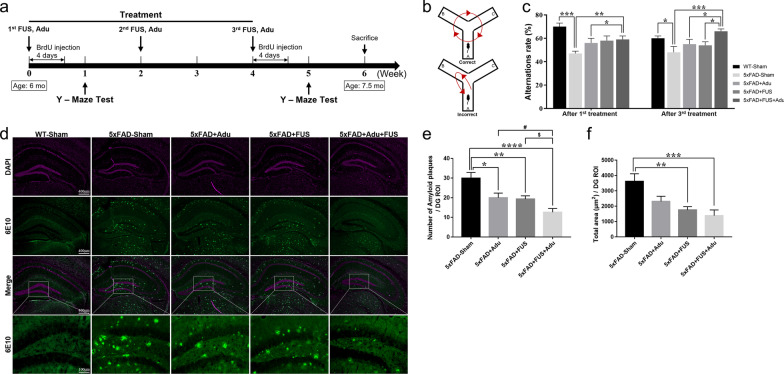
Fig. 2.
Treatment with FUS and Adu ameliorated cognitive impairment and levels of Aβ in the hippocampus. a Timeline of FUS and Adu treatment in 5×FAD mice. b Schematic illustration of the Y-maze spontaneous alternation test. c Alternation ratio in the Y-maze test at one week after the 1st treatment and at one week after the 3rd treatment. d Representative images (5×) of Aβ stained with 6E10 antibody and DAPI in the hippocampus. Bottom, representative images (20X) of Aβ stained with 6E10 antibody in the dentate gyrus of the hippocampus. e A bar graph showing the number of amyloid plaques in the dentate gyrus of the hippocampus (*P < 0.05, **P < 0.01, ***P < 0.001, and ****P < 0.0001 compared with 5×FAD-Sham mice, ANOVA followed by Tukey’s post hoc analysis, #P < 0.05 compared with 5×FAD + Adu mice, $P < 0.05 compared with 5×FAD + FUS mice by Student’s t-test, n = 11–15 mice for each group). f A bar graph showing the total area of amyloid plaques in the dentate gyrus of the hippocampus. Data are expressed as the means ± SEM. Statistical analyses were performed using one-way ANOVA, followed by Tukey’s post hoc analysis. (**P < 0.01, ***P < 0.001 compared with 5×FAD-Sham mice, n = 11–15 mice for each group)

