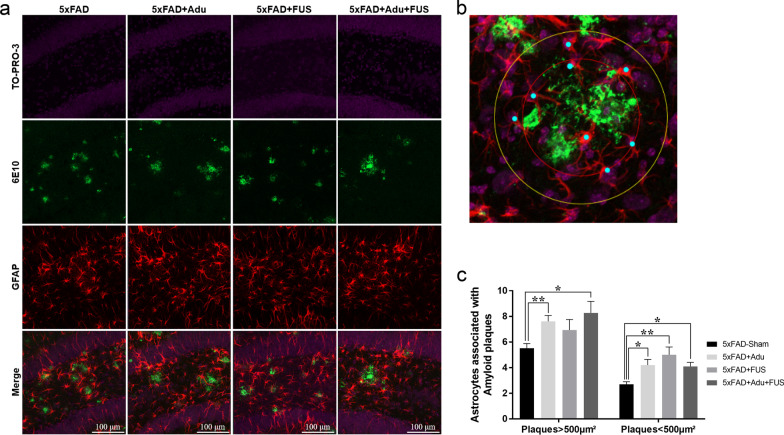
Fig. 4.
Treatment of FUS and Adu increased plaque-associated astrocytes in the hippocampus. a Representative images showing GFAP-positive cells (red) surrounding Aβ plaques (green) in the dentate gyrus of the hippocampus. b A representative higher-magnification image for the quantification of number of plaque-associated astrocytes. c A bar graph showing the number of astrocytes within 20 µm from Aβ plaques that were larger than 500 µm2 or smaller than 500 µm2. Data are expressed as the means ± SEM. Statistical analyses were performed using the Kruskal–Wallis test. (*P < 0.05 and **P < 0.01 compared with 5×FAD-Sham mice, n = 3–4 mice for each group)

