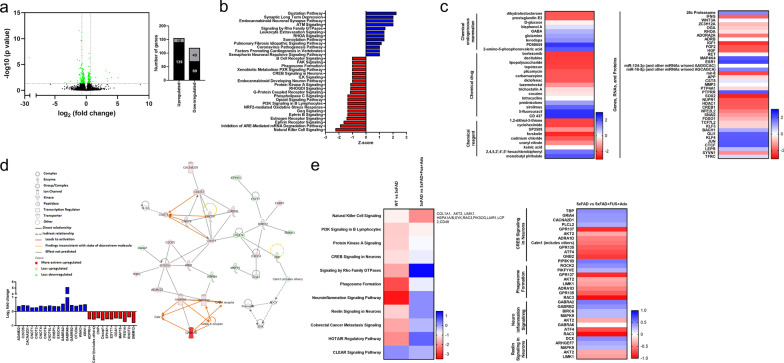
Fig. 6.
Treatment of FUS and Adu altered gene expression profiles in the hippocampus. a Left figure is a volcano plot. The x-axis represents the log2 conversion of the fold change (FC) values, and the y-axis represents the corrected significance level after base log10 conversion (q value). Green dots in the volcano plot and right graph indicate all DEGs that were found to differ significantly (q value < 0.05). The black bar in the right graph represents the number of genes with an absolute value of log2 FC greater than 0.7, and the gray bar represents the number of genes with an absolute value of log2 FC less than 0.7. b Canonical pathway analysis. Activated canonical pathway (blue bar) and inhibited canonical pathway (red bar) were identified (Z score > 1 or < − 1). c A heatmap of upstream regulators (Z score > 1 or < − 1). d A gene interaction network map (upper) and related DEGs’ log2 FC values (lower). e A heatmap of canonical pathways via comparison analysis (left) and four selected canonical pathways, including related molecules

