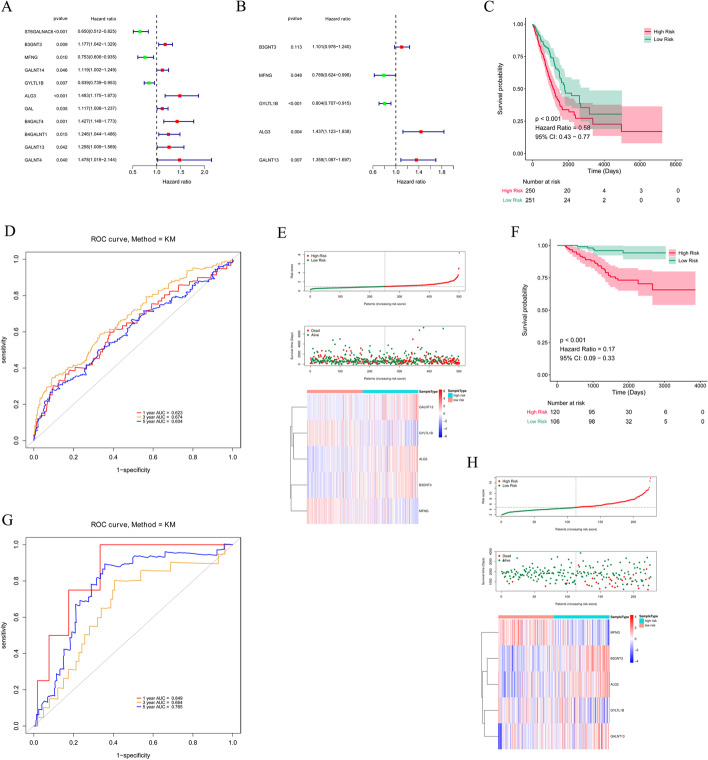
Fig. 3.
Construction and validation of the prognostic model. A Forest plot of the prognostic GTs in LUAD from TCGA cohort by Univariate Cox regression analysis. B 5 GTs identified by multivariate. Cox regression analysis. C KM survival curve of OS of LUAD patients in the TCGA cohort. D ROC curve analysis for measuring the prognostic performance of the signature-based risk score on OS. E Risk score, survival status, and 5 GTs expression heatmap of the LUAD patients in the TCGA cohort. F–H KM survival curve, ROC curve, risk score, survival status, and 5 GTs expression heatmap of LUAD patients in GSE39055 dataset

