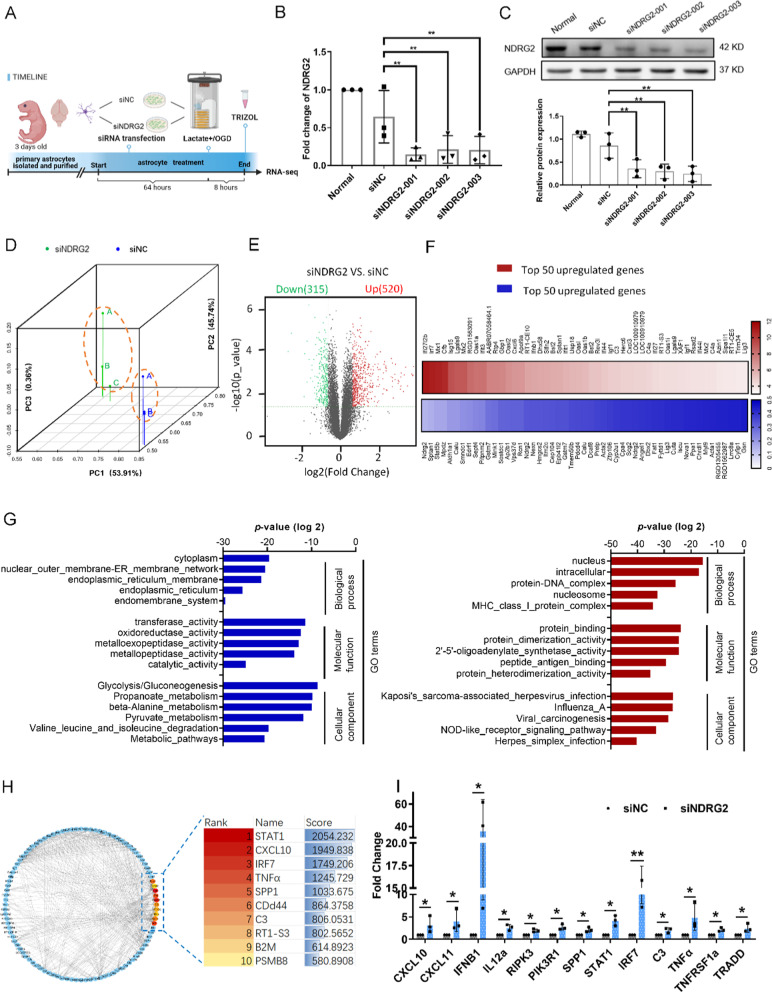
Fig. 3.
RNA-seq profiling of NDRG2-silenced astrocytes exposed to OGD conditions. NDRG2 silencing upregulates the inflammation pathway. A Primary astrocytes were isolated and purified, transfected with siRNA, and subjected to RNA-seq after 8 h of OGD and lactate stimulation conditions (Created with www.BioRender.com). B qRT–PCR analysis of NDRG2 mRNA after siRNA transfection. GAPDH was used as an endogenous control. Statistical significance was assessed using one‐way ANOVA. Data are expressed as means ± SD; n = 3, **P < 0.01 vs. siNC. C Western blot for NDRG2 protein expression after siRNA transfection. Statistical significance was assessed using one‐way ANOVA. Data are expressed as means ± SD; n = 3, **P < 0.01 vs. siNC. D Principal component analysis showing the overall transcriptomic similarity of the two groups. E Differential expression analysis reveals that NDRG2 silencing induces transcriptional changes in astrocytes under OGD and high lactate conditions. Volcano plots show differentially expressed genes (DEGs; fold change > 1.5 or ≤ − 1.5, false-discovery-rate-adjusted P-value < 0.05) in astrocytes. F The heatmap of the top 50 downregulated (blue) and upregulated genes (red) significantly affected by NDRG2 silencing in astrocytes. G GO analysis showing the top five terms significantly affected by NDRG2 silencing, from the most downregulated (blue) to the most upregulated (red). H PPI networks among the upregulated DEGs and hub genes as computed by Cytoscape. Betweenness scores were used to screen hub genes. I qRT–PCR analysis verified the expression of representative genes discovered by RNA-seq analysis after siRNA transfection. GAPDH was used as an endogenous control. Paired t-tests were used for statistical comparisons. Data are expressed as means ± SD. n = 3, *P < 0.05 and **P < 0.01 vs. siNC

