Fig. 5.
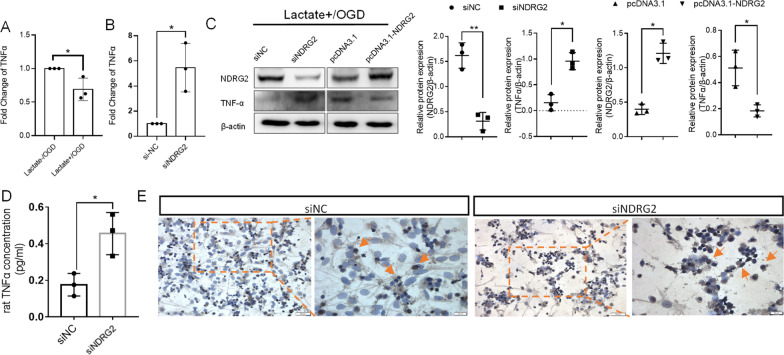
Lactate regulates TNFα expression in astrocytes through NDRG2 and affects the survival of nearby cells. A qRT–PCR analysis of TNFα mRNAs after lactate stimulation under OGD conditions. GAPDH was used as an endogenous control. Paired t-tests were used for statistical comparisons. Data are expressed as means ± SD. n = 3, *P < 0.05 vs. Lactate-/OGD. B qRT–PCR analysis of TNFα mRNAs after siNDRG2 transfection under Lactate + /OGD conditions. GAPDH was used as endogenous control. Paired t-tests were used for statistical comparisons. Data are expressed as means ± SD. n = 3, *P < 0.05 vs. siNC. C Western blots for NDRG2 and TNFα protein expression under Lactate + /OGD conditions. pcDNA3.1: control group, pcDNA3.1-NDRG2: NDRG2 overexpression group. Paired t-tests were used for statistical comparisons. Data are expressed as means ± SD. n = 3, *P < 0.05 and **P < 0.01 vs. siNC in siRNA transfection group and *P < 0.05 vs. pcDNA3.1 in NDRG2 overexpression group. D Extracellular TNFα content under Lactate + /OGD conditions measured via ELISA. Paired t-tests were used for statistical comparisons. Data are expressed as means ± SD. n = 3, *P < 0.05 vs. siNC. E TUNEL staining for intergroup differences in apoptosis (yellow arrows: apoptotic cells). Scale bar: 50 μm or 20 μm

