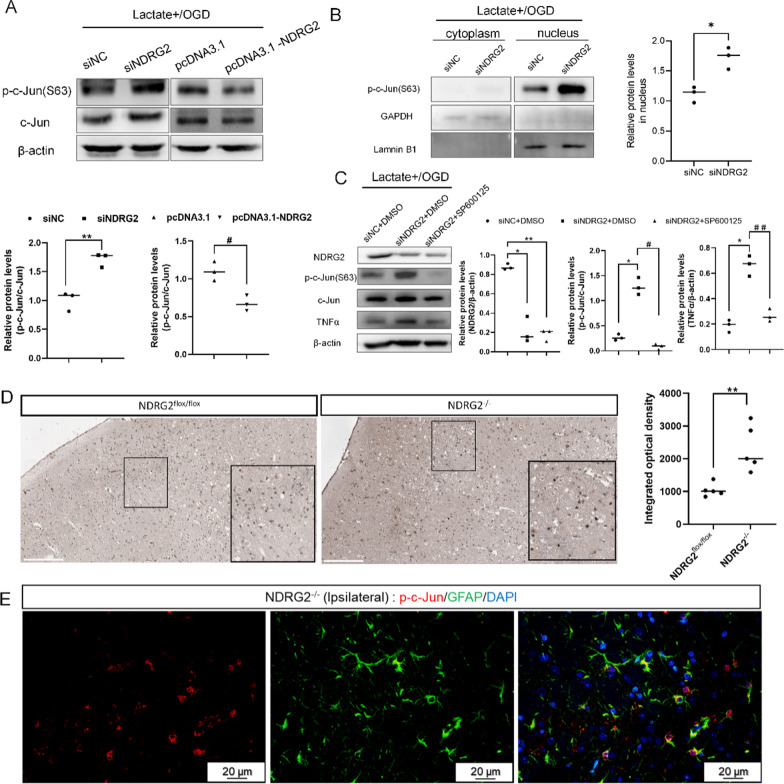
Fig. 7.
NDRG2 regulates TNFα through p–c-Jun. A Western blot analysis of relative protein expression. pcDNA3.1: control group, pcDNA3.1-NDRG2: NDRG2 overexpressed group. β-actin was used as a loading control. Paired t-tests were used for statistical comparisons. Data are expressed as means ± SD. n = 3, **P < 0.01 vs. siNC and #P < 0.05 vs. pcDNA3.1. B Western blot for relative protein expression in cytoplasm and nucleus. GAPDH was used as a loading control for cytoplasmic proteins, and laminin B1 was used as a loading control for nuclear proteins. Paired t-tests were used for statistical comparisons. Data are expressed as means ± SD. n = 3, *P < 0.05 vs. siNC in nucleus. C Western blot analysis for relative protein expression. β-actin was used as a loading control. Statistical significance was assessed using one‐way ANOVA. Data are expressed as means ± SD; n = 3, *P < 0.05 and **P < 0.01 vs. siNC + DMSO, #P < 0.05 and # #P < 0.01 vs. siNDRG2 + DMSO. D p–c-Jun immunostaining in representative sections. Scale bar: 200 μm. Unpaired t-tests were used for statistical comparisons. Data are presented as means ± SD. n = 5 random samples, ** P < 0.01 vs. NDRG2flox/flox. E Representative brain sections obtained 8 h after MCAO surgery, double-stained for p–c-Jun (red) and GFAP (green). Scale bar: 20 μm

