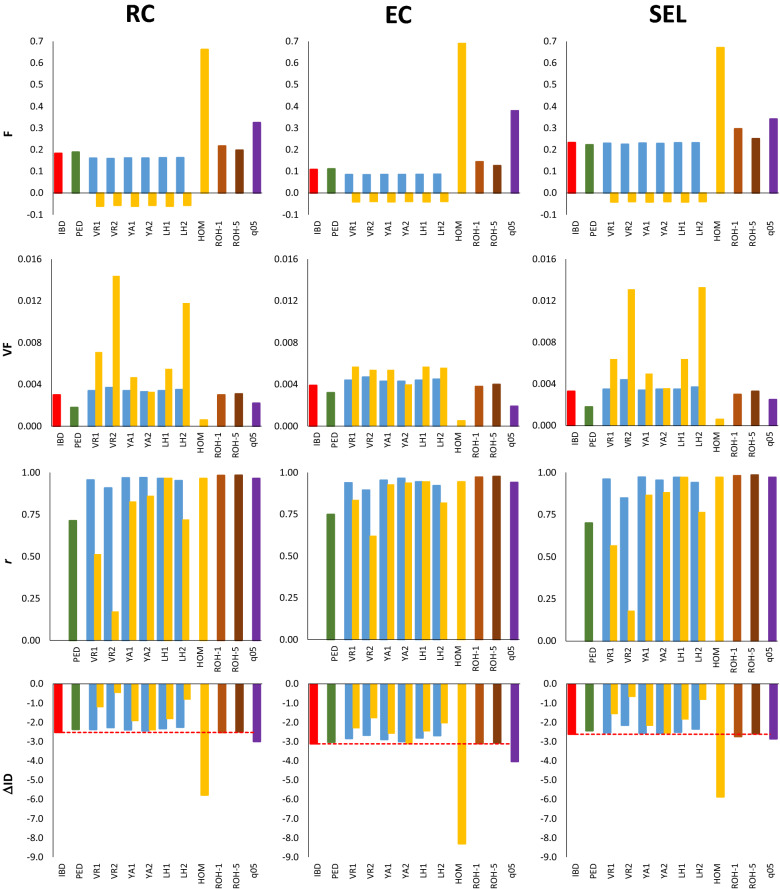
Fig. 1.
Estimates of inbreeding based on alternative measures, correlation among them, and rate of inbreeding depression for fitness obtained for a population of N = 20 breeding individuals maintained for 10 discrete generations assuming random mating and random contributions from parents to progeny (RC), equalization of contributions from parents to progeny (EC), and artificial selection for a neutral quantitative trait (SEL). Mean (F) and variance (VF) of inbreeding coefficients at generation 10, correlation between estimated inbreeding coefficients and those obtained from IBD measures (r), and mean values of the rate of inbreeding depression (ΔID). Bars refer to true IBD values (FIBD; horizontal red line), and estimated from pedigree records (FPED) and from different marker frequency-based measures (FVR1, FVR2, FYA1, FYA2, FLH1, FLH2, FHOM; see text for definitions) assuming the frequencies of the base generation (blue bars), those of the current generation (yellow bars) or a constant frequency of 0.5 (Fq05; purple bars). Estimates from runs of homozygosity are shown for fragments larger than 1 Mb (FROH-1) or 5 Mb (FROH-5). Only subscripts of estimators are shown for the sake of clarity

