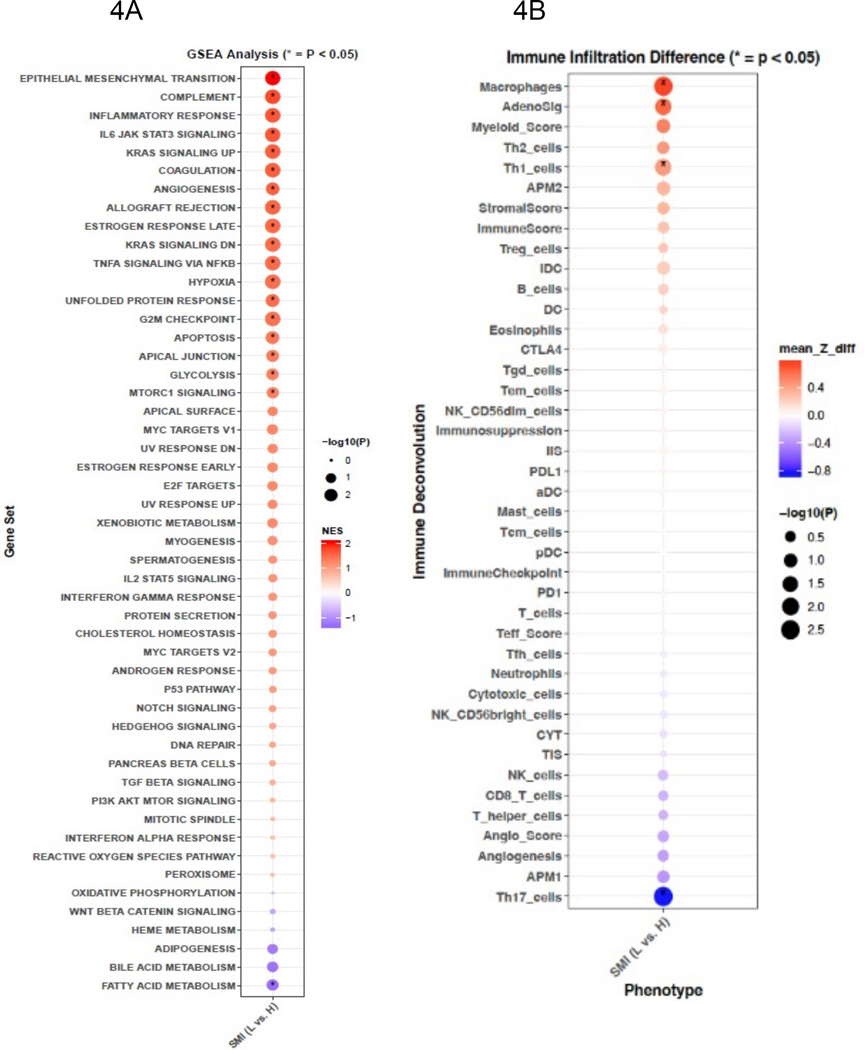
Figure 4.
GSEA analysis of Hallmark gene sets comparing differences between low and high SMI. Enrichment scores are ranked and colored based on the NES and sized by the -log10 transformed value of the adjusted p-value. Colors signify directionality of expression changes, red=up and purple=down (4A). Differences in tumor immune infiltration by immune deconvolution between low vs. high skeletal muscle index (SMI) (low (L) vs. high (H)). Colors signify directionality of expression changes, red=up and purple=down (4B)
Abbreviations: GSEA=Gene-Set Enrichment Analysis. NES=Normalized Enrichment Score. SMI=Skeletal Muscle Index, L=Low vs H=High. mean Z_diff = mean Z-score difference.

