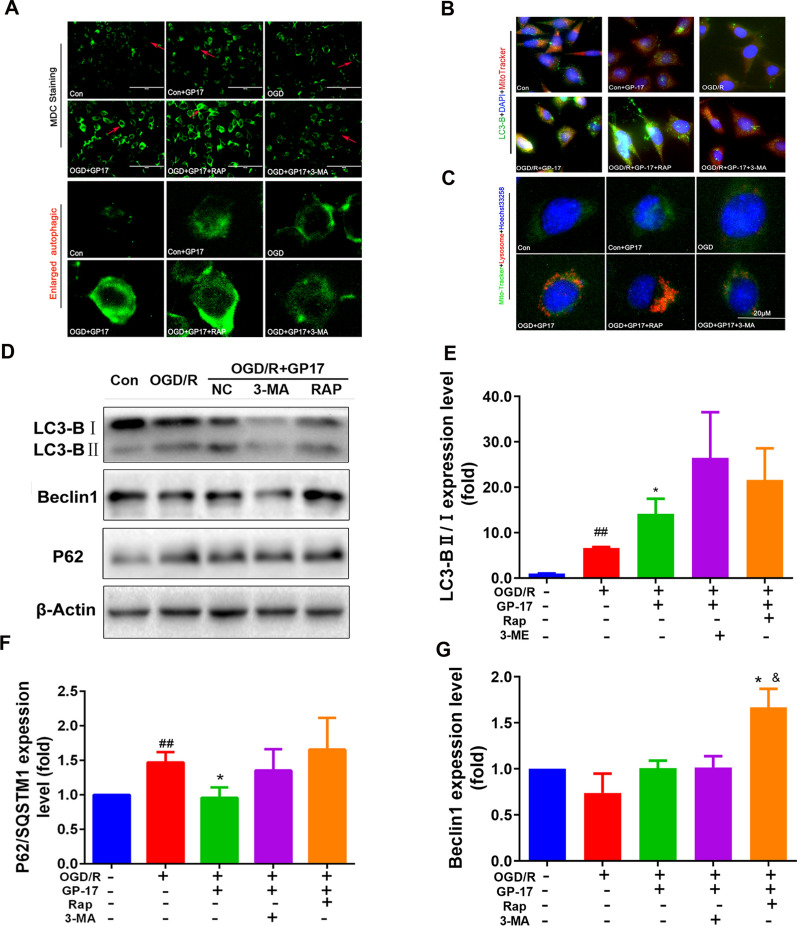
Fig. 4.
The effects of GP17 on autophagic vesicles, autophagic lysosomes, LC3-B expression and the Beclin1-LC3-P62 signalling pathway in OGD/R-subjected SH-SY5Y cells were partly reversed by the inhibitor 3-MA. A MDC staining from all SH-SY5Y cell groups as measured by a fluorescence microscope; scale bar = 100 μm. B Triple staining of autophagosome-lysosomes (red), mitochondria (green) and nuclei (blue) in OGD/R-subjected SH-SY5Y cells, as measured by a fluorescence microscope; scale bar = 20 μm. C Triple staining of LC3-B protein (green), mitochondria (red) and nuclei (blue) in OGD/R-subjected SH-SY5Y cells, as located and measured by a fluorescence microscope; scale bar, 20 μm. D The protein bands of LC3-B, Beclin1 and P62 were examined by western blot analysis in OGD/R-subjected SH-SY5Y cells. E–G. The expression levels of Beclin1 and P62, and the ratio LC3-B II and I in OGD/R-subjected SH-SY5Y cells were quantified and analysed by using Gel-Pro analyser software. The data presented as Mean values ± SEM. Statistical comparisons were performed as follows: unpaired t test for (E, F, and G); #P < 0.05, ##P < 0.01 versus the control group; *P < 0.05 versus the OGD/R model group; &P < 0.05 versus the OGD/R + GP17 group

