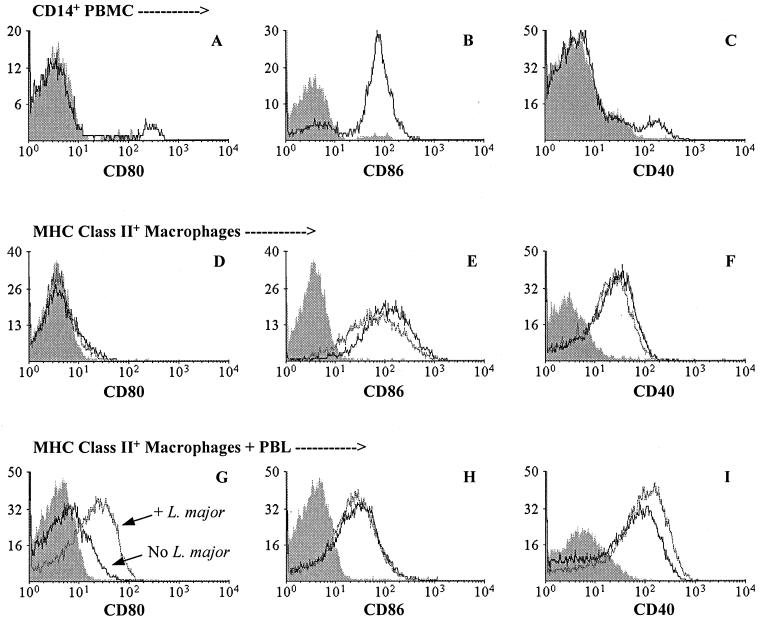
FIG. 1.
Expression of CD80, CD86, and CD40 on monocytes and macrophages. Three different populations of monocytes/macrophages were assessed for expression of CD80 (A, D, and G), CD86 (B, E, and H), and CD40 (C, F, and I) by flow cytometry before or after culture. (A to C) Expression on freshly isolated CD14+ PBMC. (D to F) Expression on MHC class II+ adherent cells (macrophages [see Materials and Methods]) for cells exposed (gray line) or not exposed (black line) to L. major during the last 24 h of 7-day cultures. Similar results were obtained for macrophages cultured for a total of 14 days. (G to I) Expression on MHC class II+ adherent cells exposed (gray line) or not exposed (black line) to L. major and cultured with PBL for an additional 7 days (14-day total culture). In all panels, shaded histograms represent nonspecific fluorescence of cells stained with an isotype control antibody. The data presented are representative of five individual donors.

