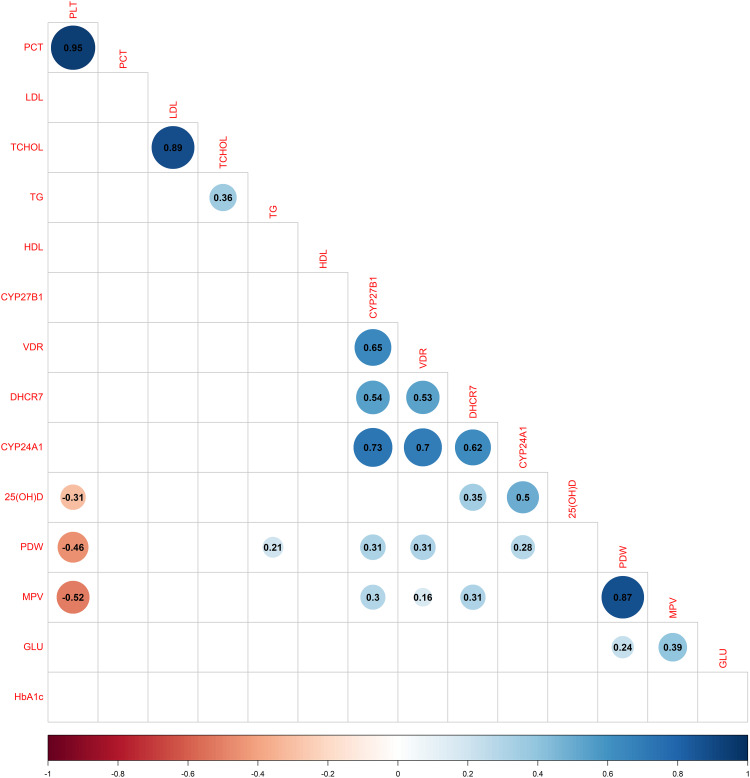
Figure 5.
Corrplot of studied correlation of methylation level of key genes in vitamin D metabolic pathway and with biochemical parameters in TB-DM. Blue colour represents positive correlation; red colour represents negative correlation; darker colors and larger shapes represent higher association. Blank represents no statistical difference.

