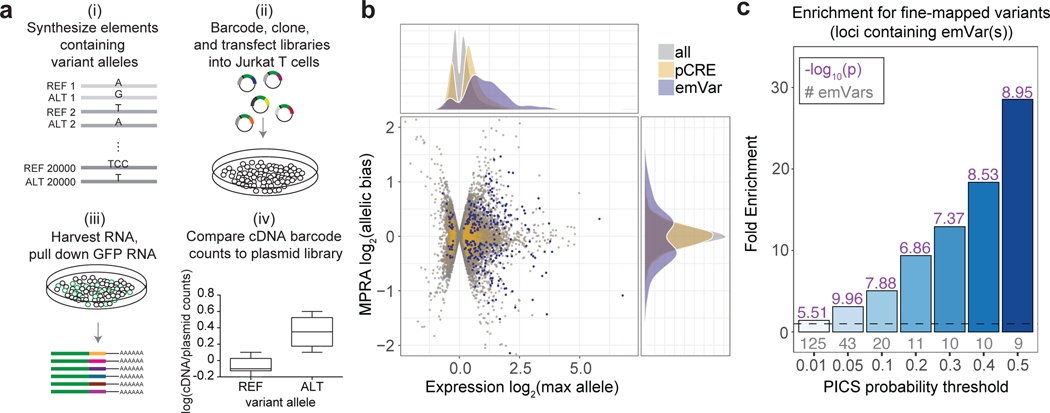
Fig. 1. Prioritizing GWAS variants using high-throughput reporter assays in Jurkat T cells.
a) Workflow for creating MPRA libraries- i) Oligonucleotide synthesis of variants and 200 bp surrounding genomic region; ii) barcoding, cloning, and transfection of plasmid library into Jurkat T cells; iii) harvesting RNA from Jurkat T cells and pull down of GFP mRNA; iv) RNA-sequencing of barcodes, normalization to their prevalence in the plasmid library, and comparison of alleles for differential reporter activity (a more detailed workflow is provided in Supplementary Fig. 1a). b) Volcano plot. The log2 expression value of the highest expressing allele is on the X axis, and the log2 of the activity of allele1/allele2 is on the Y axis. pCRE = putative cis-regulatory element; emVar = expression-modulating variant. c) Bar plot showing enrichment of emVars for PICS statistically fine-mapped variants at GWAS loci where an emVar was detected, with the minimum PICS probability threshold indicated on the X axis and bars with darker shades of blue as probability increases. Gray numbers below each bar show the number of emVars that are statistically fine-mapped at a given PICS probability threshold. Purple numbers above each bar show the -log10 of the enrichment P value. Details of PICS enrichment results are shown in Supplementary Table 11. Enrichment in (c) was calculated as a risk ratio (see Methods), and P values were determined through a two-sided Fisher’s exact test.

