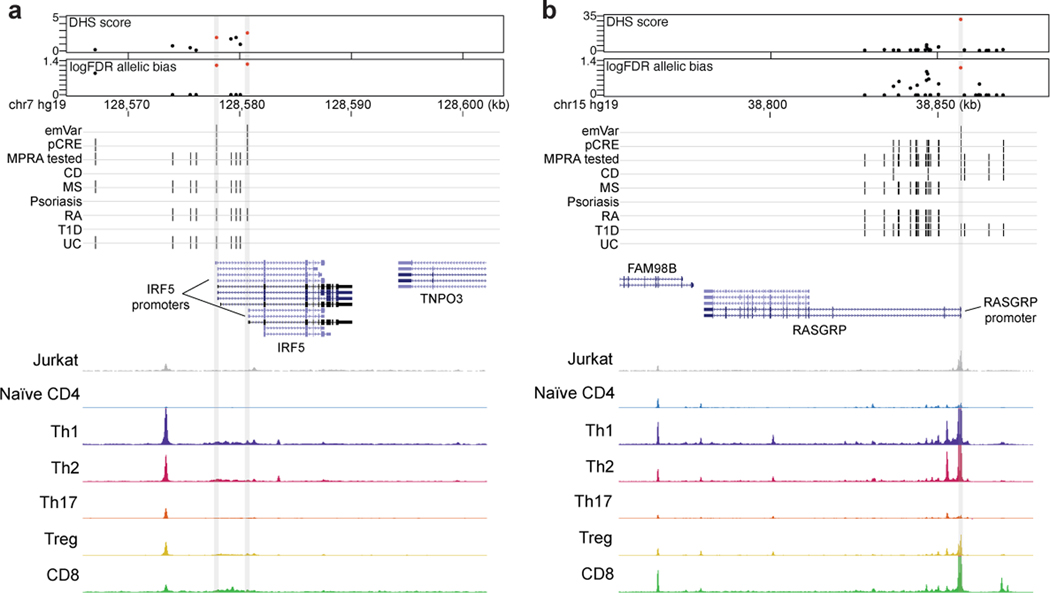
Extended Data Fig. 4.
Putative causal variants in the promoters of IRF5 and RASGRP. a and b) Dotplots showing DHS signal (DHS score) and statistical significance of allelic bias (log10FDR of MPRA allelic bias) for MPRA variants in the region; all tested variants on haplotype (black), significant emVars in DHS (red) (top). Position of variants that are emVars, pCREs, variants tested in MPRA, and disease associated variants for CD, MS, psoriasis, RA, T1D, and UC from the GWAS Catalog54 (middle). Genes in the locus are shown along with chromatin accessibility profiles (from in Jurkat and specific T cell subsets) and T cell pcHiC loops anchored on the region containing the emVar. Gray line depicts position of the prioritized emVar position with respect to all data types. Statistical significance of allelic biases in (a) and (b) were calculated using a paired Student’s two-sided t-test as described in Methods.

