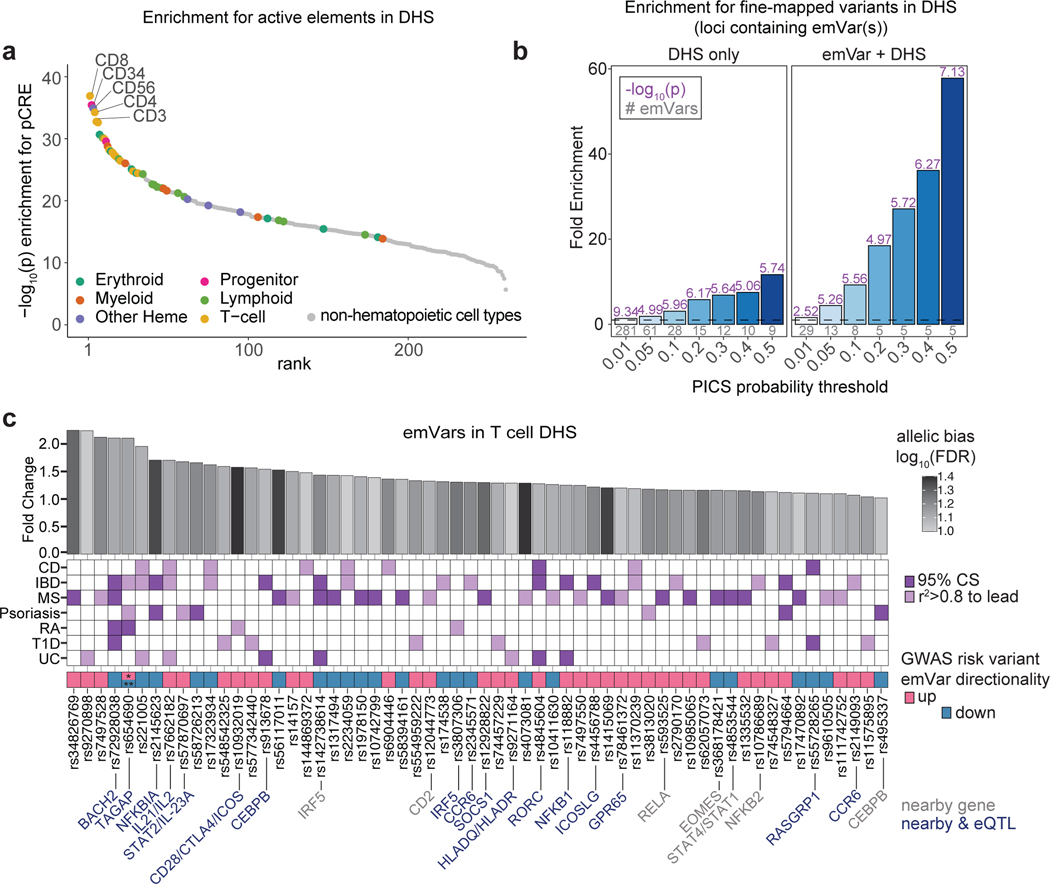
Fig. 2. T-GWAS emVars in T cell accessible chromatin enrich highly for fine-mapped variants.
a) Enrichment of DHS sites from hematopoietic and non-hematopoietic cell types for MPRA pCREs. Cell types are ranked from left to right from most statistically significant to least significant. Hematopoietic cell types are colored by their ontogeny as indicated in the legend. Non-hematopoietic cell types are shown in gray. Y-axis shows the -log10 of the enrichment P value. b) Enrichment of statistically fine-mapped variants within T cell DHS sites (left) and enrichment of statistically fine-mapped variants that are emVars within T cell DHS sites (right), with darker shades of blue as probability increases. Details of PICS enrichment results are shown in Supplementary Table 9. c) Bar plot (top) of 60 emVars in T cell DHS sites with their allelic bias (y-axis) and log2FDR (shade of bar). GWAS for which emVar is associated (middle). emVars in 95% fine-mapping credible sets are shown in dark purple, while variants in tight LD to lead the variant (r2 > 0.8) but not in credible sets are shown in light purple. Immediately underneath, pink and teal boxes indicate the MPRA expression directionality of the GWAS disease risk-increasing variant as compared to the non-risk variant, followed by variant rsIDs. For one variant, rs654690, the risk alleles are opposing depending on disease, with * indicating the risk allele for both psoriasis and IBD, and ** indicating the risk allele for RA. Nearby genes that are known to play a role in T cell differentiation and function (gray) and nearby genes for which the variant is an eQTL (dark blue; according to Open Targets Genetics;53 are listed on bottom. Enrichments (a) were determined through a two-sided Fisher’s exact test. Enrichment in (b) was calculated as a risk ratio (see Methods), and P values were determined through a two-sided Fisher’s exact test. Statistical significance of allelic bias in (c, top bar plot) was calculated using a paired Student’s two-sided t-test.

