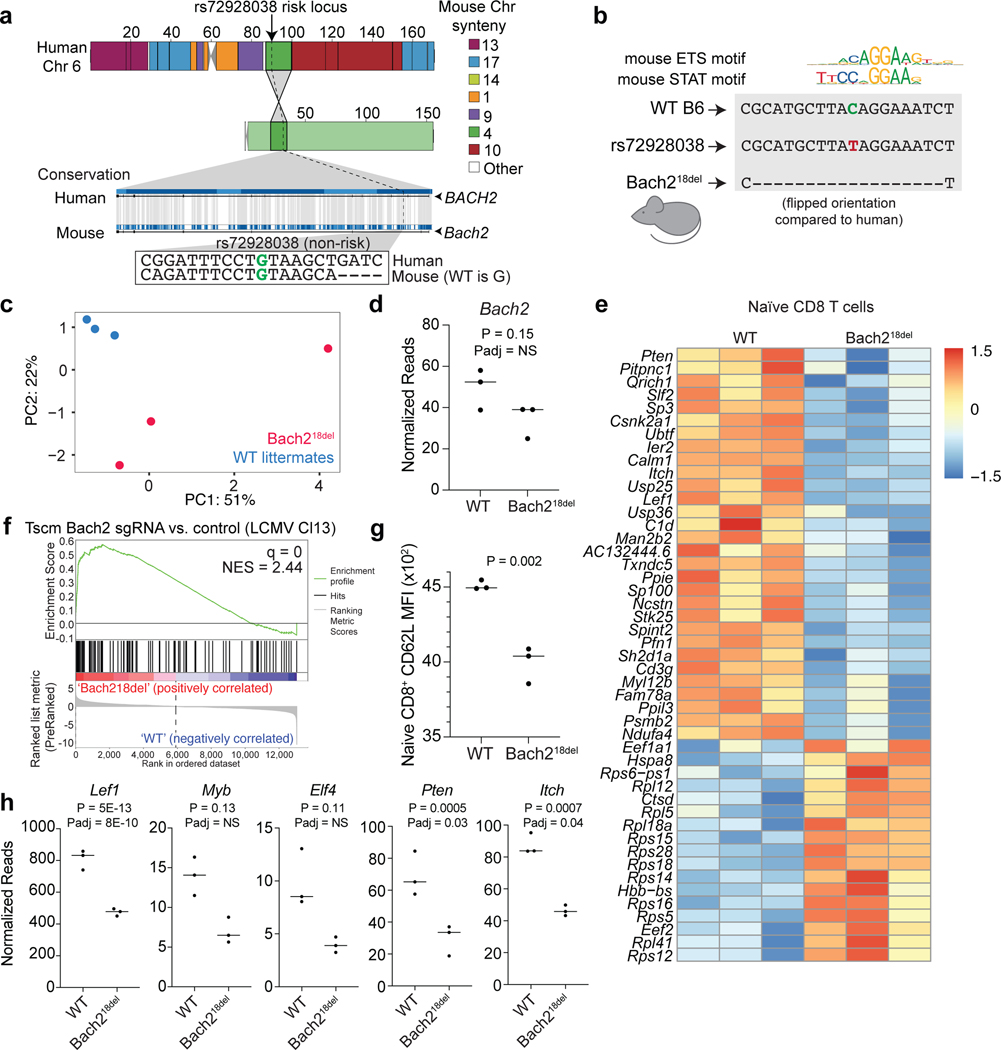
Fig. 5. Naïve T cells from mice with a deletion overlapping orthologous rs72928038 have reduced transcriptional features of stemness.
a) Synteny analysis of rs72928038 between human and mouse. Location of rs72928038 (arrow and dotted line) on human chromosome 6 and mouse chromosome 4 (top) with colors indicating mouse chromosome synteny (see key). Conservation of human BACH2 with mouse Bach2, with the location of rs72928038 noted (dotted line), with inset showing conserved sequence between human and mouse at the site of rs72928038 (bottom). b) Schematic of Bach218del mutation. c) Principal components 1 and 2 from gene expression analysis of naïve CD8 T cells from Bach218del and their WT littermates. d) Bach2 gene expression within naïve CD8 T cells from WT and Bach218del mice. e) Expression heatmap of differentially expressed genes between WT and Bach218del naïve CD8 T cells (n = 3 animals per genotype). f) GSEA showing enrichment of Bach218del vs. WT naïve CD8 T cells for a gene set derived from genes differentially expressed in Bach2 guide RNA-targeted CD8 Tscm cells vs. empty vector Tscm cells. Full GSEA results are shown in Supplementary Table 13. g) Mean fluorescence intensity of CD62L surface expression on naïve WT and Bach218del CD8 T cells. h) Sample genes differentially expressed between WT and Bach218del mice in naïve CD8 T cells (c-h, n = 3 per animals per genotype). P values in (d), (e), and (h) were determined by a two-sided Wald test for significance of GLM coefficients and adjusted P values were determined using the Benjamini and Hochberg method. P values in (g) were obtained through Student’s two-sided t-test. For (d), (g), and (h), central tendency shown as median and all points are plotted to show dispersion. Normalized enrichment score (NES) in (f) was calculated based on observed enrichment as compared to enrichments from permuted data and statistical significance shown as the false discovery rate (q)58.

