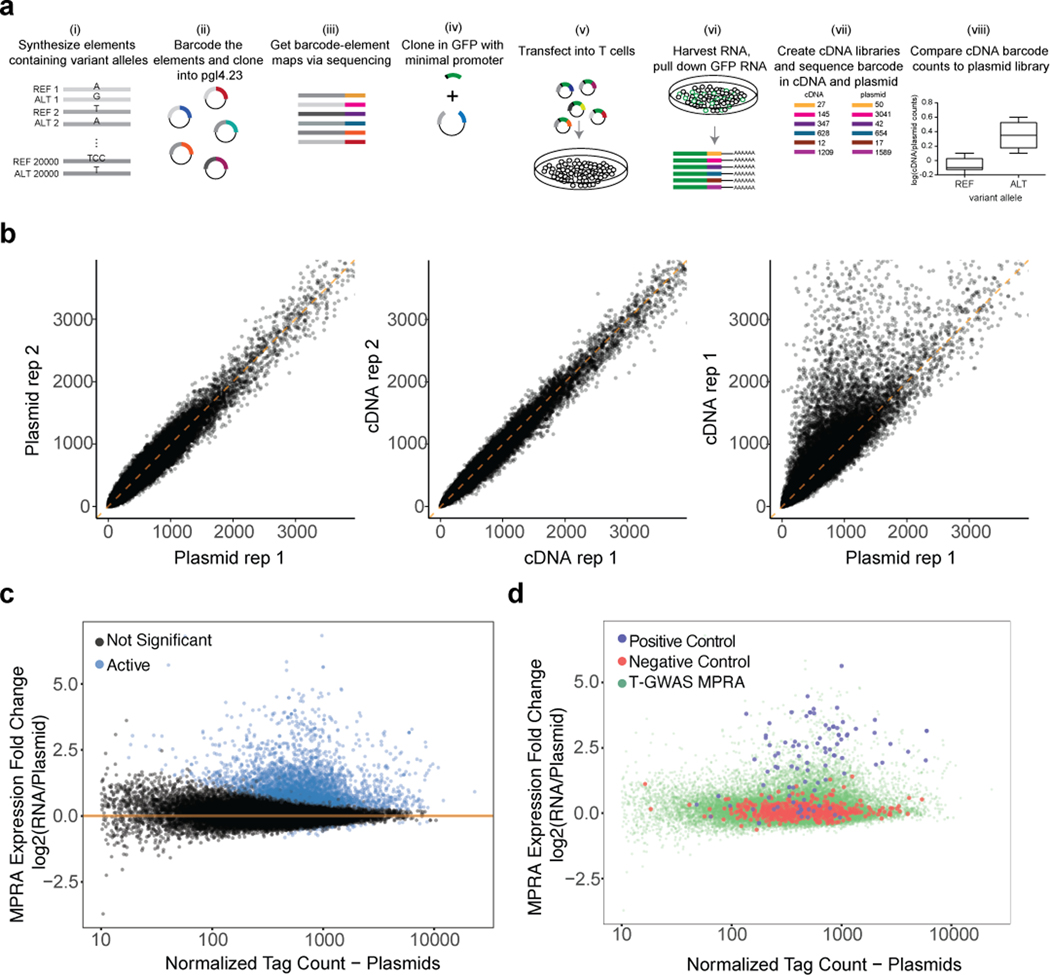
Extended Data Fig. 1.
T-GWAS MPRA workflow and quality metrics T-GWAS MPRA workflow and quality metrics a) Extended MPRA workflow. i) Oligonucleotide synthesis of elements containing variants and 200 bp surrounding genomic region; ii) barcode elements through PCR; iii) sequence barcoded elements to link barcodes to elements; iv) insert minimal promoter and GFP between element and barcode; v) transfect library into Jurkat T cells; vi) harvest RNA and pull down GFP mRNA; vii) create cDNA and plasmid sequencing libraries and sequence, comparing the prevalence of barcodes in cDNA to their prevalence in plasmid libraries; viii) compare alleles for differential reporter expression. b) Correlation of barcode prevalence in separate replicates of plasmid libraries (left), biological replicates of cDNA libraries (middle), and between a cDNA library and a plasmid library (right). c) Plot of MPRA expression fold change (log2 RNA/plasmid; y-axis) against normalized plasmid tag counts for elements with putative cis-regulatory activity (active; blue) and inactive elements (black) within the T-GWAS library. d) Plot of MPRA expression fold change (log2 RNA/plasmid; y-axis) against normalized plasmid tag counts for positive controls and negative controls compared to T-GWAS elements.

