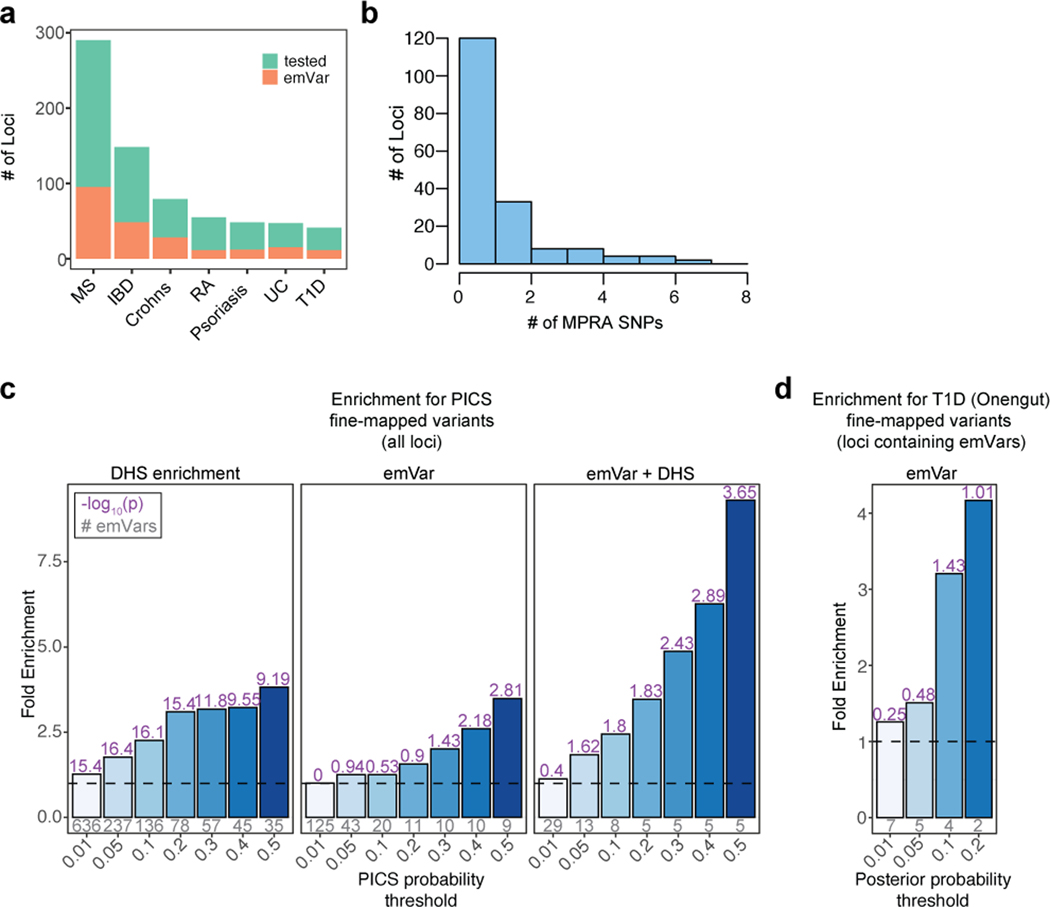
Extended Data Fig. 3.
MPRA prioritizes variants in hundreds of loci. a) Total number of GWAS loci tested (green) and number of loci with at least one emVar identified (orange) for each disease GWAS. b) Histogram of the number of emVars within each GWAS locus. c) Bar plot showing enrichment (from all loci tested) of DHS alone (left), emVars (middle), and emVars in T cell DHS (right) for PICS fine-mapped variants, with the minimum posterior probability threshold indicated on the x-axis and fold enrichment shown on the y-axis and bars with darker shades of blue as probability increases. Details of PICS enrichment results are shown in Supplementary Table 10. d) Bar plot showing enrichment of emVars for fine-mapped T1D GWAS loci from Onengut-Gumuscu et al. Statistical fine-mapping posterior probability threshold is shown on the x-axis and fold enrichment shown on the y-axis and with darker shades of blue as probability increases. For both c) and d), gray numbers below each bar show the number of emVars that are statistically fine-mapped at a given PICS probability threshold. Purple numbers above each bar show the -log10 of the enrichment P value. Enrichment in (c) and (d) were calculated as a risk ratio (see Methods), and P values were determined through a two-sided Fisher’s exact test.

