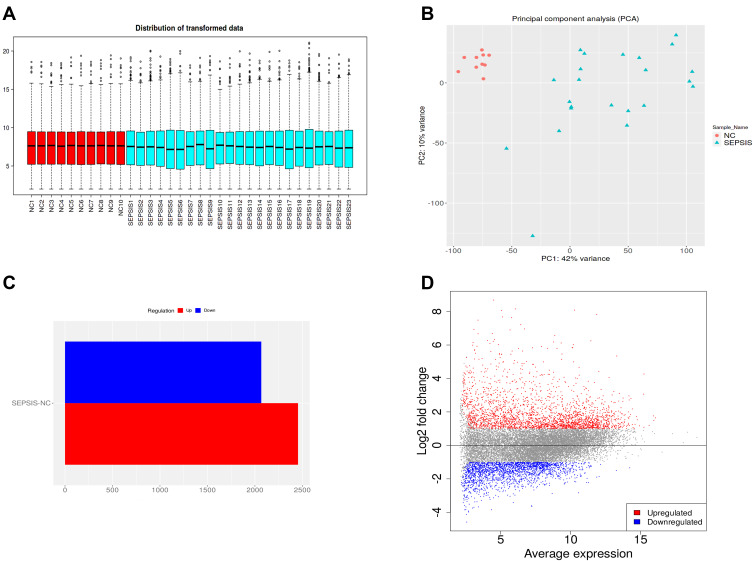
Figure 1.
Data quality control and differentially expressed RNA screening. (A) Box plot shows that the data of each sample are distributed at the same level after uniformization, which is comparable. (B) PCA analysis shows the two groups could be clearly distinguished, and there were no outlier samples. (C) The histogram shows the upregulated (red) and downregulated (blue) genes screened under the conditions of FC≥2 and FDR<0.05, the abscissa is the number of differentially expressed RNA, and the ordinate is the grouping. (D) Volcano plot shows differentiating up-regulated (red) and down-regulated (blue) genes, as well as undifferentiated genes (black), with the abscissa being the average expression and the ordinate being log2FC.

