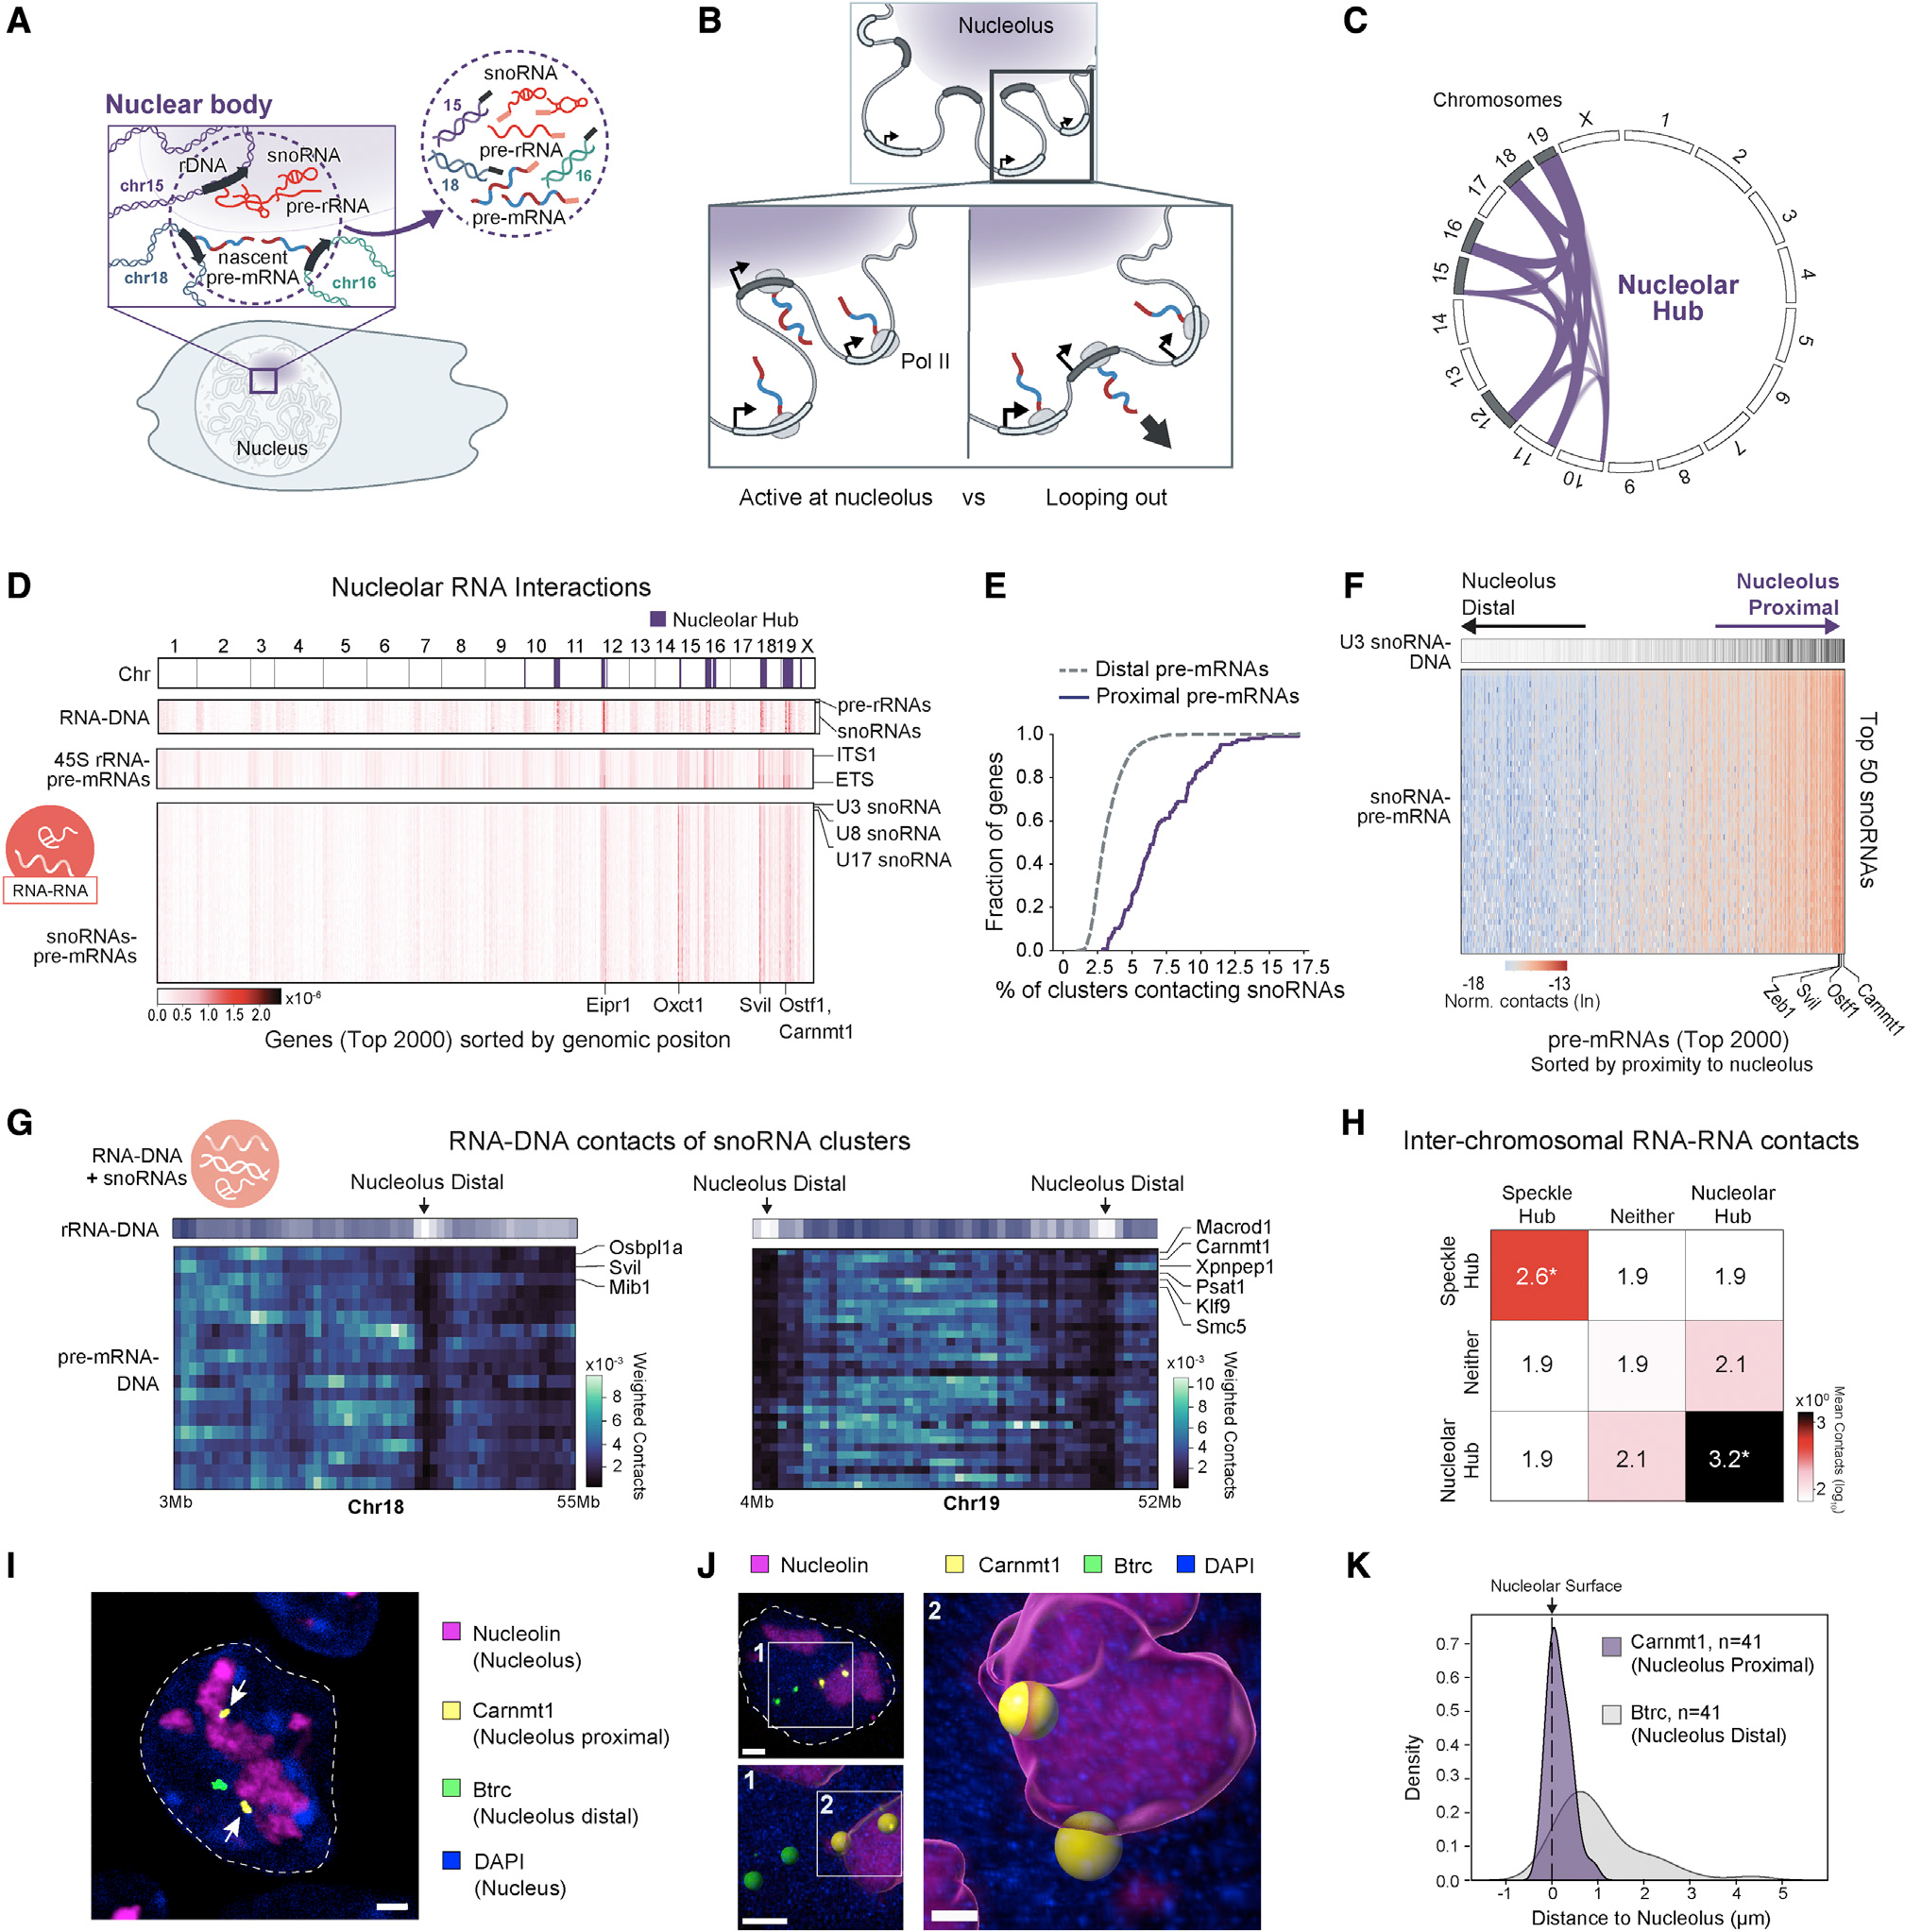
Figure 4. Transcription of RNA polymerase II genes can occur in proximity to the nucleolus.

(A) Schematic of the molecular interactions occurring near the nucleolus and their corresponding RNA and DNA interactions measured within an RD-SPRITE cluster (circle). Because RD-SPRITE clusters can capture long-distance interactions, a single cluster can measure multiple interacting RNA (pre-mRNAs) and DNA molecules (genomic loci) around RNA bodies (containing 45S rRNA and snoRNAs).
(B) Two models of RNA Pol II gene transcription for nucleolar-proximal genes.
(C) Diagram of inter-chromosomal DNA contacts between nucleolar hub regions. Chromosomes in gray contain ribosomal DNA genes.
(D) RNA-DNA interactions (top box) corresponding to RNAs known to reside in the nucleolus (y axis; snoRNAs and 45S pre-rRNAs) with genomic loci (x axis; binned per gene) are shown along the top. RNA-RNA interactions (bottom two boxes) between the top 2,000 expressed pre-mRNAs (x axis; STAR Methods) and nucleolar RNAs (y axis; 45S pre-rRNA and snoRNAs) are shown. Genes are ordered along the x axis based on genomic position. Three components of 45S pre-rRNA spacers (ITS1, ITS2, 3′ETS) and the top 50 snoRNAs in descending order by contact frequency are along the y axis. DNA loci within the nucleolar hub are annotated in purple.
(E) Cumulative density of pre-mRNA contacts with snoRNAs for nucleolar proximal (purple) and nucleolar distal (gray) genes.
(F) Nascent pre-mRNA-snoRNA contact matrix for the top 2,000 genes. Genes are ordered based on their distance to the nucleolus, defined by contact frequency of the genomic locus to nucleolar hub regions in RD-SPRITE. Heatmap of U3 snoRNA-DNA density at the genomic bin corresponding to each gene is shown.
(G) Unweighted pre-mRNA-DNA contacts occurring in SPRITE clusters containing snoRNAs for nucleolar genes of chromosome 18 (left) and 19 (right). 45S pre-rRNA density (RNA-DNA contact frequency) is shown as a heatmap, indicating nucleolar close (purple) and far (white) regions.
(H) Average unweighted inter-chromosomal RNA-RNA contacts of the top 2,000 nascent pre-mRNAs grouped by hub (speckle hub, nucleolar hub, neither). *p < 0.01. p values were calculated relative to an expected distribution generated by randomizing RNAs reads across SPRITE clusters and calculating the resulting inter-chromosomal RNA-RNA contact frequency (STAR Methods).
(I) Immunofluorescence (IF) combined with intron RNA-FISH for two genes on chromosome 19: Carnmt1 (yellow), a nucleolar-proximal gene, and Btrc (green), a nucleolar-distal gene. Both alleles of Carnmt1 are transcribed while located adjacent to the nucleolus (Nucleolin; purple). Nucleus is demarcated with DAPI. Arrows highlight the nucleolar-proximal pre-mRNAs located adjacent to nucleoli. Scale bar represents 2 μm.
(J) 3D surface representation of intron RNA-FISH for Carnmt1 (yellow) and Btrc (green) and IF for Nucleolin (purple). Zoom-out (upper left, scale bar represents 2 μm) shows original FISH and IF signals in the entire cell. Zoom-ins show spheres corresponding to FISH signal and nucleolar surface (lower left, scale bar represents 2 μm) and the two transcribed Carnmt1 alleles intersecting the nucleolar surface (right, scale bar represents 0.7 μm).
(K) Distribution of 3D distances between the nucleolar surface and Carnmt1 (purple) or Btrc (gray) nascent transcripts quantified from intron RNA-FISH and IF images (n = 22 cells).
