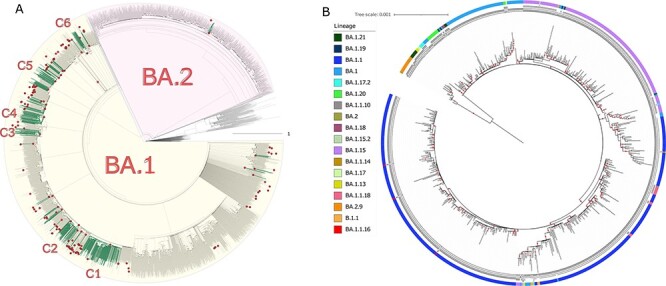
Figure 1.

Omicron phylogeography and phylogenomic analysis. (A) The analysis on the temporal scale shows the 160 introduction events in Mexico. The nodes shown as outline circles correspond to the most recent common ancestor (MRCA) of clades resulting from an introduction event. The green branches correspond to the Mexican sequences. The gray branches, on the other hand, correspond to samples from other countries. (B) Maximum likelihood phylogeny of the Mexican lineages, each indicated in the legend. Only bootstrap values ≥80 are indicated with red dots, and the scale bar represents the number of substitutions per site.
