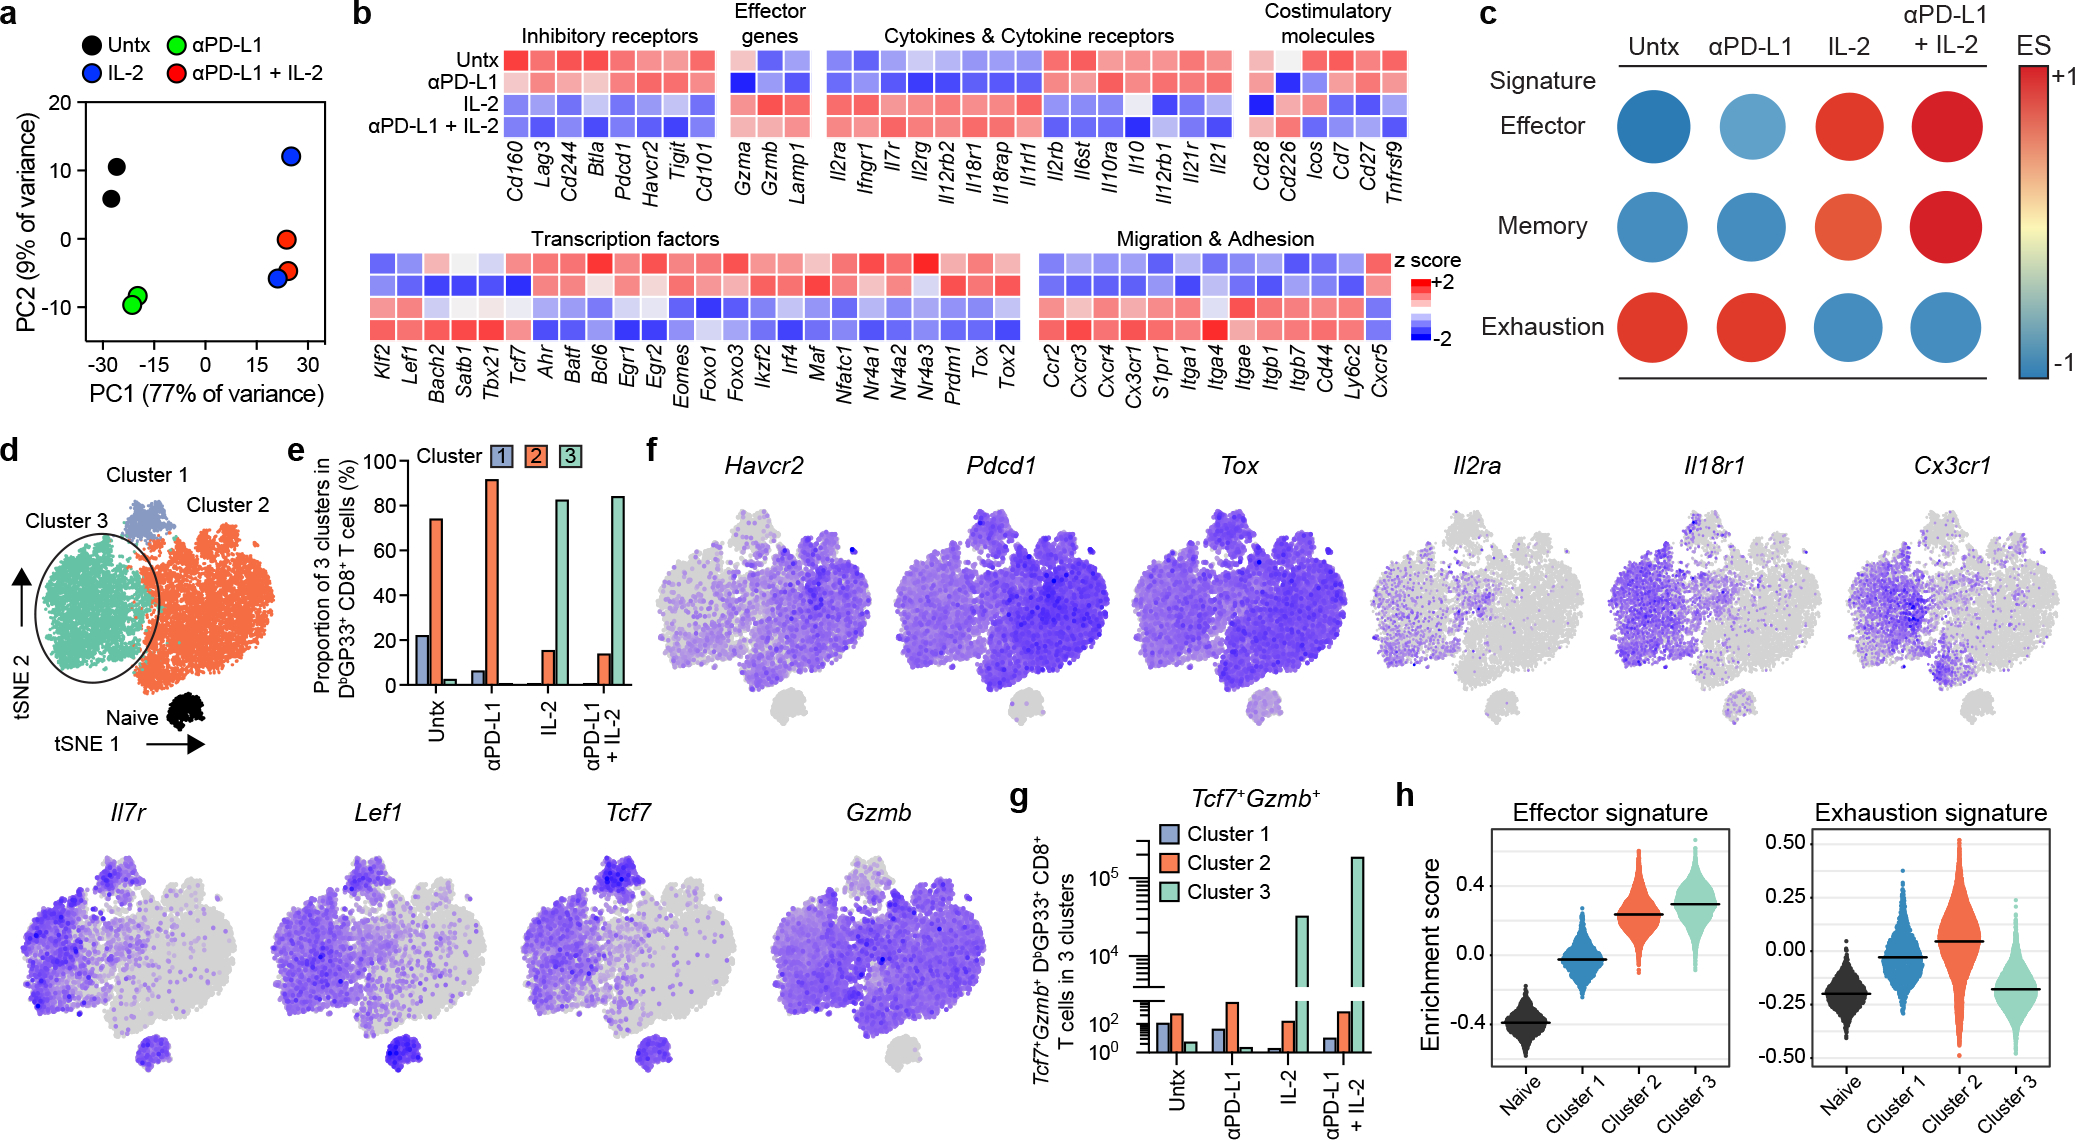
Fig. 2. Distinct transcriptional signature of virus-specific CD8+ T cells after PD-1 + IL-2 combination therapy compared to PD-1 monotherapy during chronic LCMV infection.

a–h, Mice chronically infected with LCMV were treated with PD-1 monotherapy, IL-2 alone, or combination therapy for 2 weeks. LCMV-specific DbGP33+ CD8+ T cells from spleens of each treatment group were sorted for RNA-seq (a-c) and scRNA-seq (d-h) analysis. As a control, naive CD44low CD8+ T cells were also sorted for scRNA-seq (d-h). a, PCA plot of DbGP33+ CD8+ T cells after the indicated treatments. b, The mean relative expressions of specific genes. c, GSEA of DbGP33+ CD8+ T cells generated by the indicated treatments for effector and memory signatures (acute infection), and exhaustion signature (chronic infection). The colour and size of the circles represent the enrichment score (ES) for each signature. d, t-SNE projections of naive CD44low CD8+ T cells and DbGP33+ CD8+ T cells generated by the various treatments. Four clusters (one for naive and three for treatment samples) were defined and are indicated by different colours. The new cluster (cluster 3) generated after combination therapy or IL-2 treatment is highlighted by the black circle. e, The proportions of three clusters in DbGP33+ CD8+ T cells in each treatment group. f, Normalized expression of several representative genes is shown within the four clusters. g, Numbers of Tcf7+Gzmb+ DbGP33+ CD8+ T cells that are present in clusters 1, 2, and 3 after the various treatments. h, GSEA of DbGP33+ CD8+ T cells in each of three clusters for effector signature (acute infection) and exhaustion signature (chronic infection). Enrichment score for the signature in each cluster is shown as violin plots; the horizontal bars show the mean. Results were pooled from 2 (a–c) and 1–2 (d–h) experiments with n =2–18 mice per group in each experiment.
