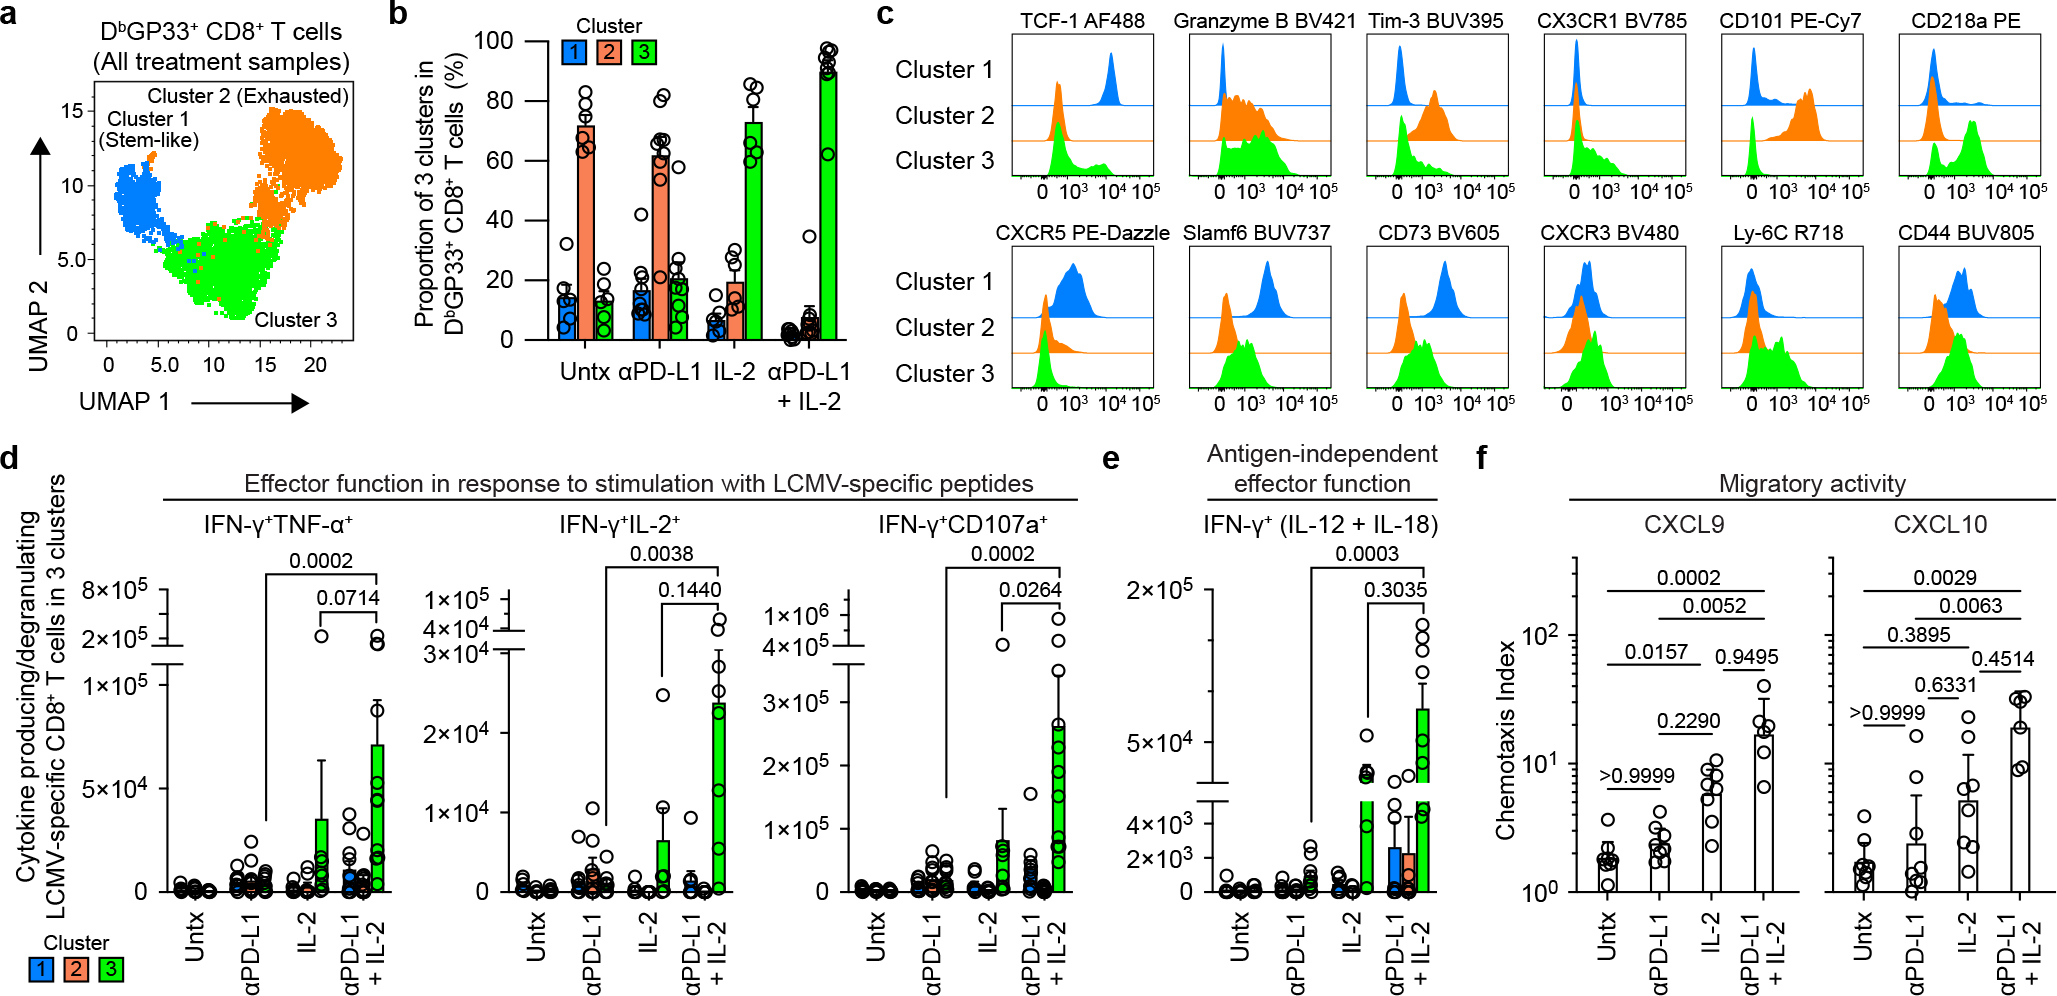
Fig. 3. Phenotypic and functional characterization of LCMV-specific CD8+ T cells generated by PD-1 and IL-2 monotherapy and the combination therapy during chronic infection.

LCMV chronically infected mice were either untreated or treated with PD-1 therapy, IL-2 treatment or the combination therapy for 2 weeks. a, Representative UMAP with FlowSOM overlay showing three clusters of concatenated DbGP33+ CD8+ T cells isolated from spleens after the four treatments. b, The proportions of three clusters of DbGP33+ CD8+ T cells in the different groups of mice. c, Representative histograms of various phenotypic markers expressed by DbGP33+ CD8+ T cells in the three clusters. d, Effector function in response to stimulation with LCMV-specific peptides. Spleen cells were stimulated with pools of LCMV-specific peptides for 5 h and analyzed by intracellular staining for cytokine production and degranulation. Summary data for numbers of PD-1+ LCMV-specific CD8+ T cells producing IFNγ and TNFα, IFNγ and IL-2, and IFNγ plus degranulation (CD107a+) are shown as a function of the three clusters in the different treatment groups. e, Antigen-independent effector function. Spleen cells were stimulated with IL-12 and IL-18 (20 ng ml−1 each) for 6h without any viral peptides. Cells were then stained with surface markers including DbGP33-specific tetramer, fixed, and followed by intracellular staining of IFNγ. Summary data for numbers of LCMV-specific CD8+ T cells producing IFNγ+ in an antigen-independent manner as a function of the three clusters in the various treatment groups. f, Chemotaxis index for CXCL9 and CXCL10. Sorted PD-1+ CD8+ T cells obtained from pooled spleens of chronically infected mice treated for 2 weeks by each treatment were tested for chemotaxis to CXCL9 and CXCL10. For a–e, the results were pooled from 2–4 experiments with 1–8 mice per group in each experiment. Data are mean ± s.d. (b), mean ± s.e.m (d and e), or geometric mean ± 95% CI (f). P values are shown; statistical comparisons were performed using Kruskal-Wallis test with Dunn’s multiple comparison test (d–f).
