
Fig. 5. CD25 blockade abrogates the synergy between IL-2 and PD-1 blockade.
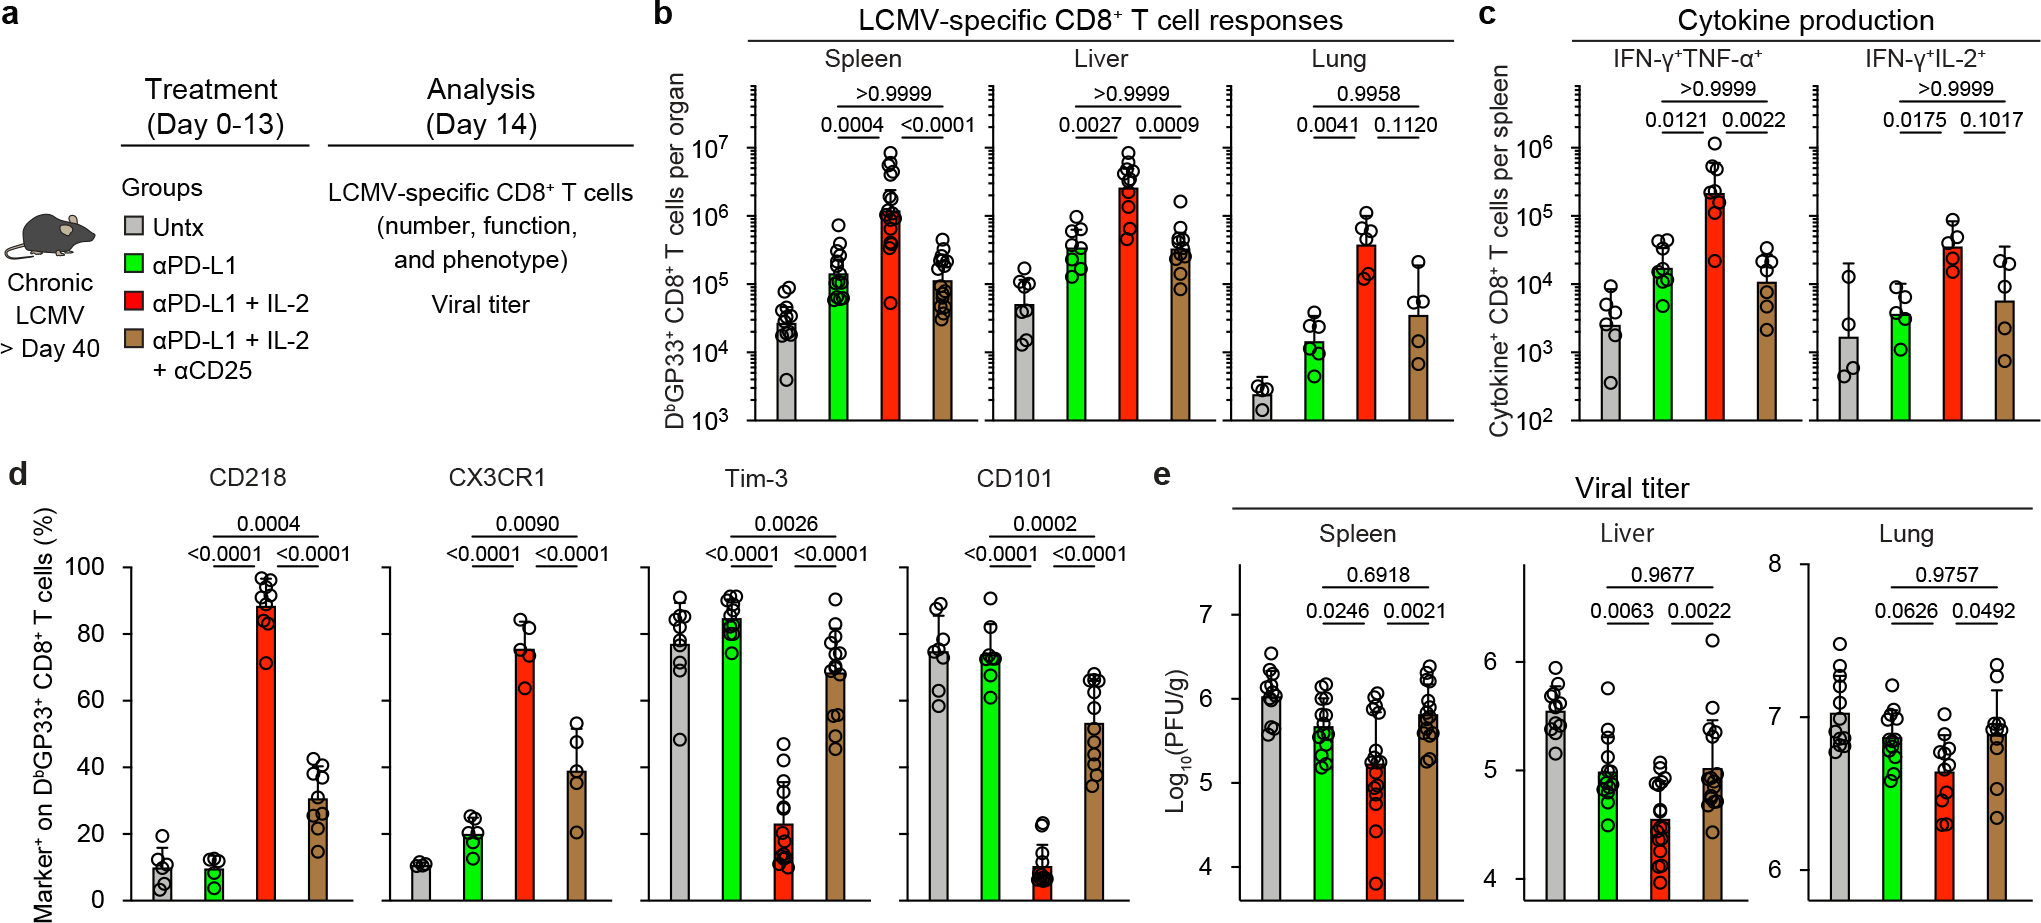
a, Chronically infected mice were left untreated, or were treated with anti-PD-L1 antibodies, or combination therapy with anti-PD-L1 plus IL-2 for two weeks. One additional group was given the combination therapy plus a blocking anti-CD25 (PC61-N297Q) antibody for 2 weeks. The LCMV-specific CD8+ T-cell response and viral titre were analyzed on day 14. The colour key in a applies to b–e. b, LCMV-specific CD8+ T cell responses. The numbers of DbGP33+ CD8+ T cells in the indicated tissues for all four groups of mice are shown. c, The numbers of IFNγ+, IFNγ+TNFα+, and IFNγ+IL-2+ CD8+ T cells in the different groups of mice. Spleen cells were stimulated with pools of LCMV-specific peptides for 5 h and analyzed by intracellular cytokine staining. d, The phenotype of DbGP33+ CD8+ T cells from the indicated treatment group. e, Viral titre in the indicated tissues in the four groups of mice. The results were pooled from 2–6 experiments with at least 4 mice per group. Data are geometric mean ± 95% CI (b and c) or mean ± s.d. (d and e). P values are shown; statistical comparisons were performed using Kruskal-Wallis test with Dunn’s multiple comparison test (b and c) or one-way ANOVA with Tukey’s multiple comparison test (d and e).