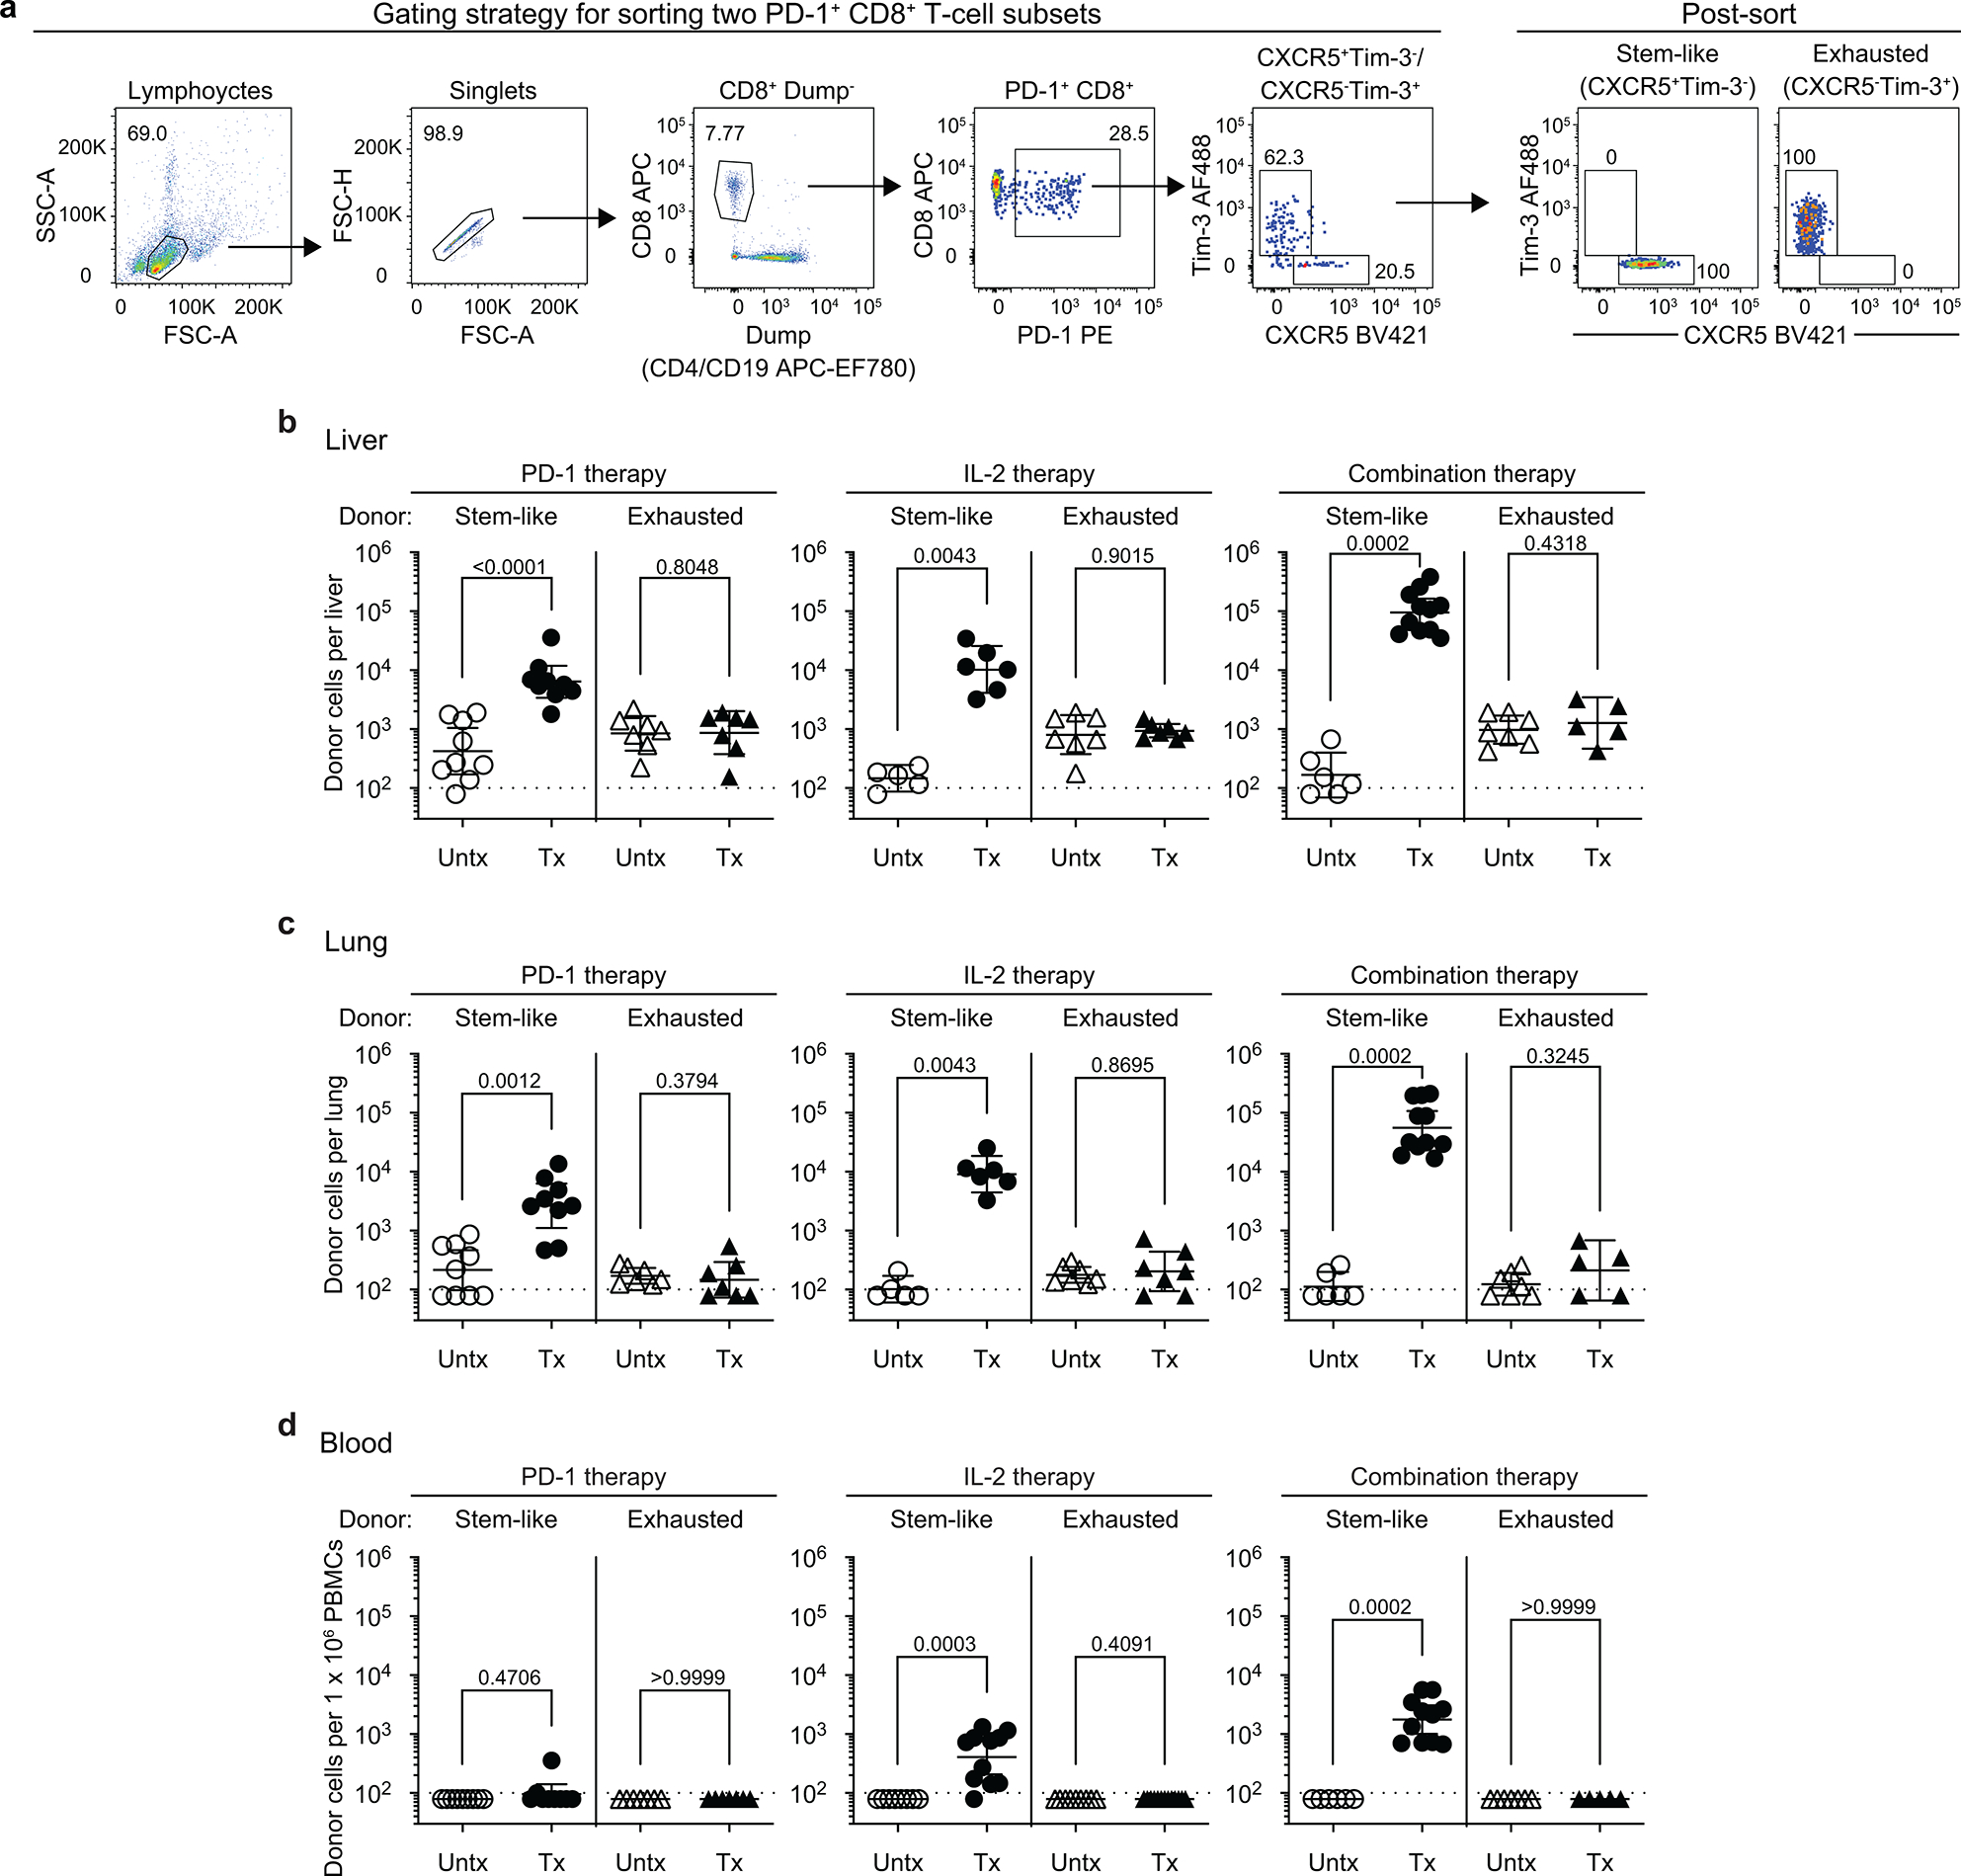
Extended Data Fig. 2. The proliferative response after PD-1 blockade, IL-2 therapy, and PD-1 + IL-2 combination therapy comes from the same population of PD-1+ TCF-1+ stem-like CD8+ T cells.

a, Gating strategy for sorting stem-like (PD-1+CXCR5+TIM3−) and exhausted (PD-1+CXCR5−TIM3+) CD8+ T-cell subsets isolated from spleens of CD45.2+ LCMV chronically infected mice. b-d, Summary data for the numbers of donor CD45.2+ CD8+ T cells after 2 weeks of PD-1 therapy, IL-2 therapy, and the combination therapy in liver (b), lungs (c), and blood (per 1 × 10⁶ PBMCs) (d) of the recipient mice. Results were pooled from 3–4 experiments with n = 7–9 (PD-1 therapy), n = 5–13 (IL-2 therapy), and n = 5–11 (PD-1 + IL-2 combination therapy) per group. Data are presented as geometric mean and 95% CI (b–d) with p values. Dotted line indicates the limit of detection. Statistical comparisons were performed by using two-tailed unpaired Mann-Whitney test. AF, Alexa Fluor; EF, eFluor; Tx, treated; Untx, untreated.
