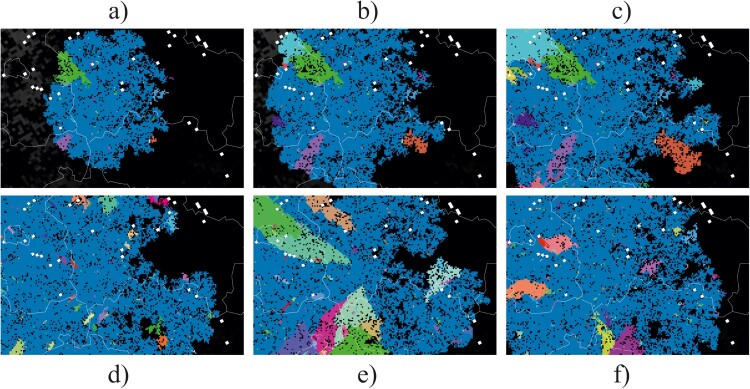
Figure 2.
Model output as spatial snapshots with different variants differently coloured, either showing the dynamic development of infection distribution (a–c) or mapping the stochastic variability of the final distribution (d–f). Pixels represent social groups of individual wild boar and lines are administrative borders.

