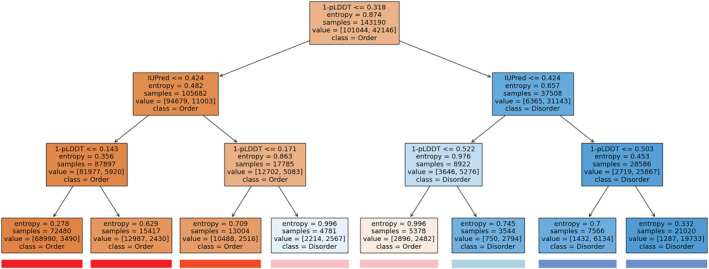
FIGURE 1.

Decision tree calculated from the prediction of IUPred3 and the pLDDT scores of AlphaFold2 on the CAID‐PDB dataset using Shannon entropy as the base for information gain. Color boxes underneath each leaf node represent the coloring of sequential features on DisCanVis.
