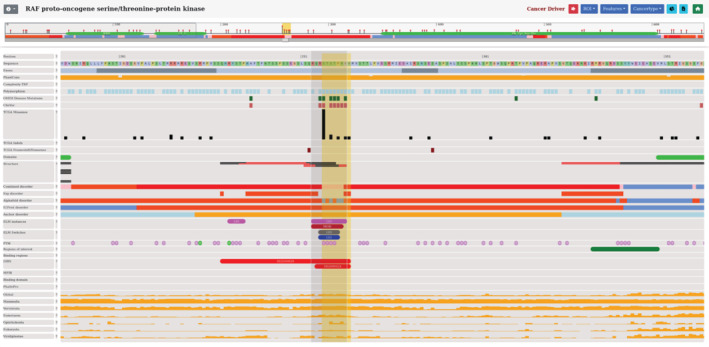
FIGURE 3.

Visualization of RAF1 showing the 14‐3‐3 binding phosphopeptide motif region. Features with no data within this region are turned off. The mutation hotspots can be observed at the top of the figure in the genetic variation section. OMIM disease and cancer‐associated mutations are depicted by green and black boxes, respectively. Functional annotations and structural information are presented in the middle of the figure. Evolutionary conservation scores are shown at the bottom of the figure.
