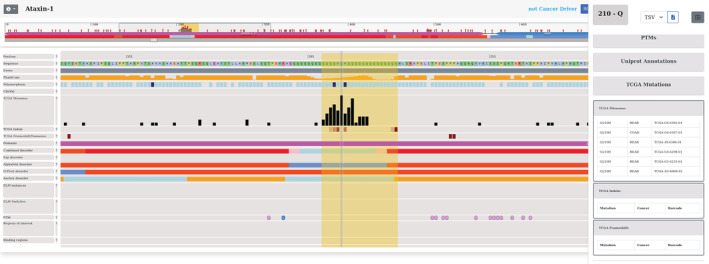
FIGURE 5.

Entry page of ATXN1 positioned on the mutational hotspot region. Missense mutations and indels are depicted by black and red boxes, respectively. The specific region contains common polymorphisms (indicated by dark blue boxes). Protein disorder information is presented in the middle of the plot. At the bottom of the figure, in the functional annotation section there is no data displayed about the region of interest. Sequence conservation viewer is turned off. The panel on the right side presents more detailed information about the selected position (Q210), including the sample IDs in which the position was mutated. The region highlighted by a yellow box represents the significantly mutated region.
