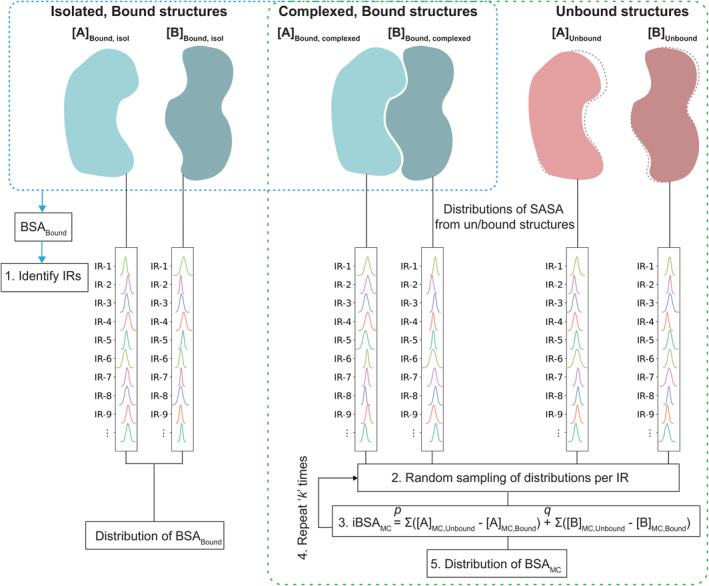
FIGURE 1.

Graphical representation of the method. Bound structures of a complex [AB] are represented as blue blobs and its individual components [A] and [B] in unbound states are represented as pink blobs. Bound structures are used to identify the most probable IRs (i.e., as described in Step 1 in Section 4) and distribution of BSA bound from bound structures only (blue dotted box). All bound structures in complexed state and all unbound structures are used to create prob. density functions (represented as columns with multiple curves) of SASA values per IR. These are used for random sampling by Monte Carlo method and finally to estimate distribution of BSAMC from Monte Carlo method. BSA, buried surface area; IR, interface residue; SASA, solvent accessible surface area.
