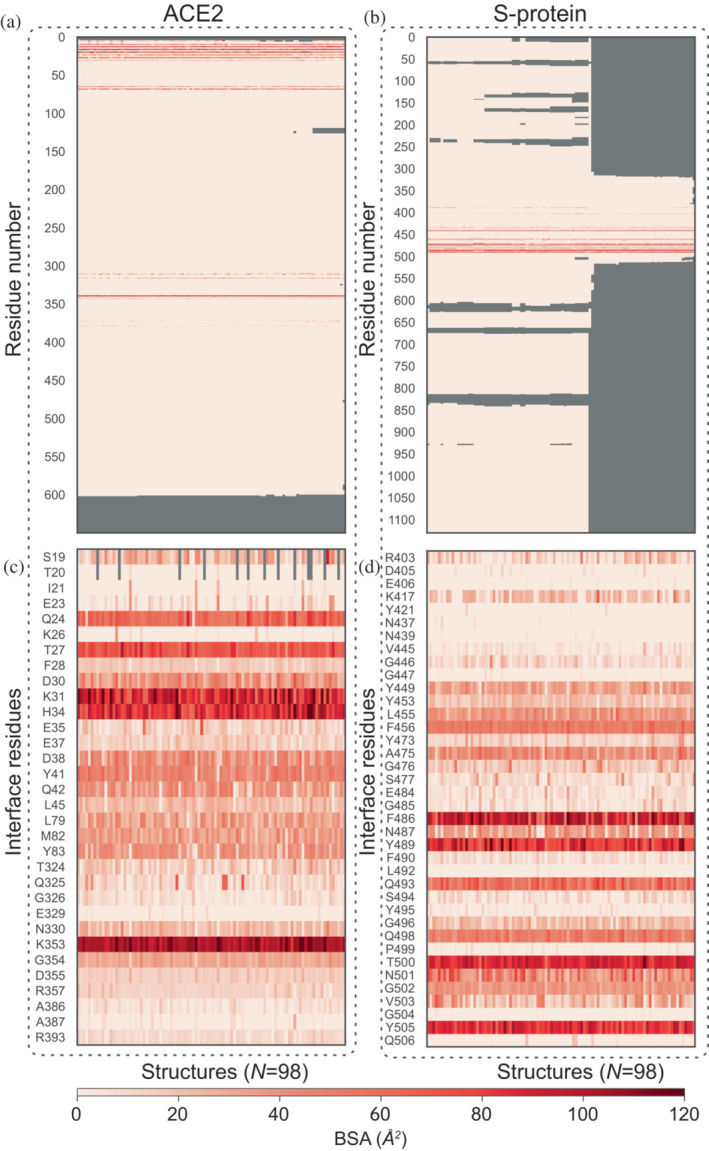
FIGURE 2.

Heatmap of BSA. Panels (a) and (b) show the BSA per residue across all bound structures (N = 98) and over the full sequence of ACE2 and S‐protein, respectively. Among these, the most probable IRs of ACE2 and S‐protein are easily identified as those with BSA greater than a threshold set at 1.5 Å2, and are plotted in panels (c) and (d), respectively. BSA, buried surface area; IR, interface residue.
