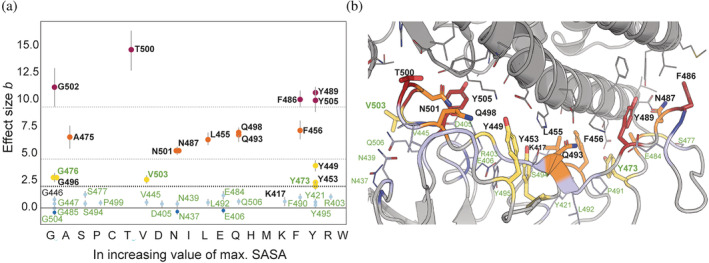
FIGURE 5.

Bayesian effective size (b) versus SASA of amino acids in increasing order. (a) Values of Bayesian effective size calculated for pairs of SASA distributions for isolated S‐protein from ACE2‐S‐protein complex and for unbound S‐protein for each of the IRs (Figure 4) plotted versus maximal SASA value for each of the proteinogenic amino acids. The names of each of the IRs correspond to WT residue at the position. In bold are represented residues with the effect size above 2.0 (lower dotted line). Those are the majority of the IRs identified in previous publications (black) as well as three IRs identified in present study (green): G476, V503, and Y473. Additionally, we noticed that we can separate the IRs into groups whose effective size lies below 2.0 (light blue), between 2.0 and 4.0 (yellow), between 4.0 and 9.0 (orange), and above 9.0 (red). The mentioned thresholds are marked with dotted lines. The residues from each group were visualized (PDB ID: 7A94) and color‐coded accordingly (b). The visualization demonstrates that the residue (red shade) above the threshold of 9.0 is closest to the ACE2 interface (gray). The residues from the second and third groups (between 4.0 and 9.0 as well as 2.0 and 4.0, respectively) are more distant (orange and yellow shades), and the residues from the group below 2.0 are placed in the rim regions of the interface (shades of blue). IR, interface residue; SASA, solvent accessible surface area.
