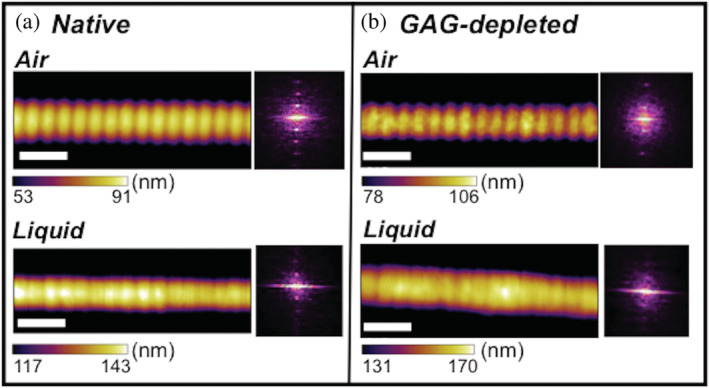
FIGURE 3.

AM‐AFM imaging of collagen I fibrils. Collagen I fibrils bear a regular, characteristic D‐banding pattern that is produced by the staggered arrangement of triple helical collagen monomers in the fibril. This D‐banding is resolved here by AM‐AFM experiments for both (a) native and (b) GAG‐depleted collagen I fibrils (with an estimated 76% GAG depletion) imaged in air and liquid environments. Fibril heights of five fibrils from the same rat tail for all conditions ranged from ≈55–160 nm (Avg. 117.1 ± 47.4 nm) for native fibrils and ≈100–250 nm (Avg. 156.6 ± 59.6 nm) for GAG‐depleted fibrils in air and ≈100–285 nm (Avg. 209.5 ± 85.3 nm) for native fibrils and ≈165–430 (Avg. 286.6 ± 96.5 nm) for GAG‐depleted fibrils in liquid. It is important to note that although the native and GAG‐depleted fibrils may differ in height, fibril height has been shown to not correlate with indentation modulus. 53 The white scale bars are 200 nm in each image. The Fourier transform insets show the periodicity of each fibril and scale bar ranges were chosen to accentuate the D‐banding in the images. Uncropped height, amplitude, and phase images are shown in the SI (Figures S2, S3). AM‐AFM amplitude modulation‐atomic force microscopy; ECM, extracellular matrix; GAG, glycosaminoglycans
