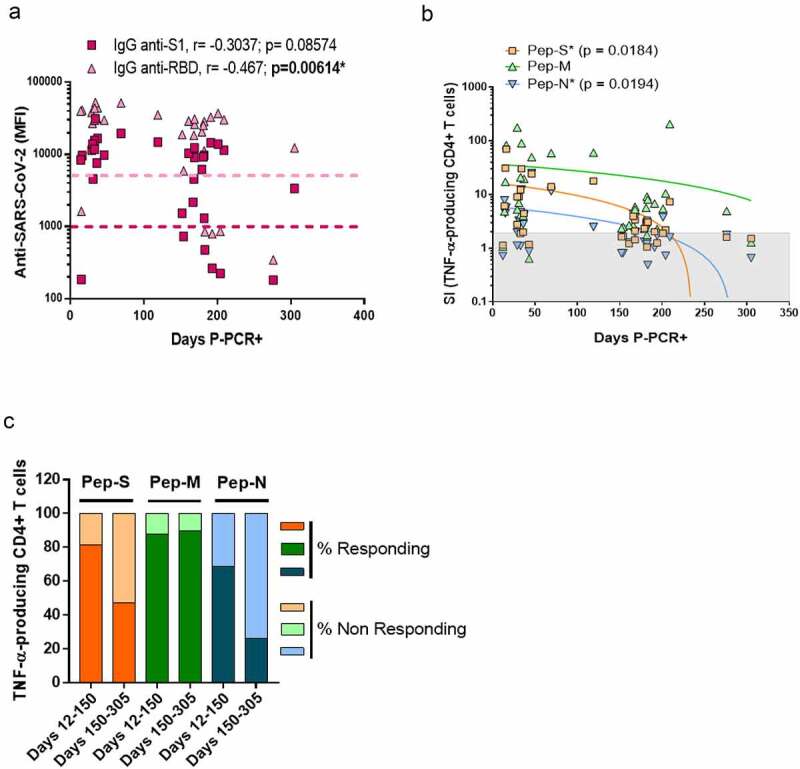
Figure 3.

Specific CD4+ T-cell response to SARS-CoV-2 peptides at 10 months post-infection.
(a) Correlation between the plasma levels of anti-S1 and anti-RBD (anti-SARS-CoV-2 immunoglobulins) and the time between the detection of COVID-19 infection (PCR+) and the time of sample processing (days post-PCR+; P-PCR+). Coloured dotted lines represent the threshold of detection. N=33. (b) Correlation between the SI of TNF-α-producing CD4+ T-cells after stimulation and days P-PCR+. Symbols in the gray zones represent samples with SIs less than 2, indicating non-responding individuals. Correlations were assessed using Spearman’s rank correlation; * p < 0.05 was considered significant. Each symbol corresponds to an individual, N=35. (c) Stacked bars represent the frequencies of individuals with TNF-α-specific T-cell responses corresponding to SIs ≥ 2 (responding) or < 2 (non-responding) when cells were stimulated by Pep-S, Pep-M or Pep-N, in individuals tested 12–150 days P-PCR+ or 150–305 days P-PCR+. N=35.
