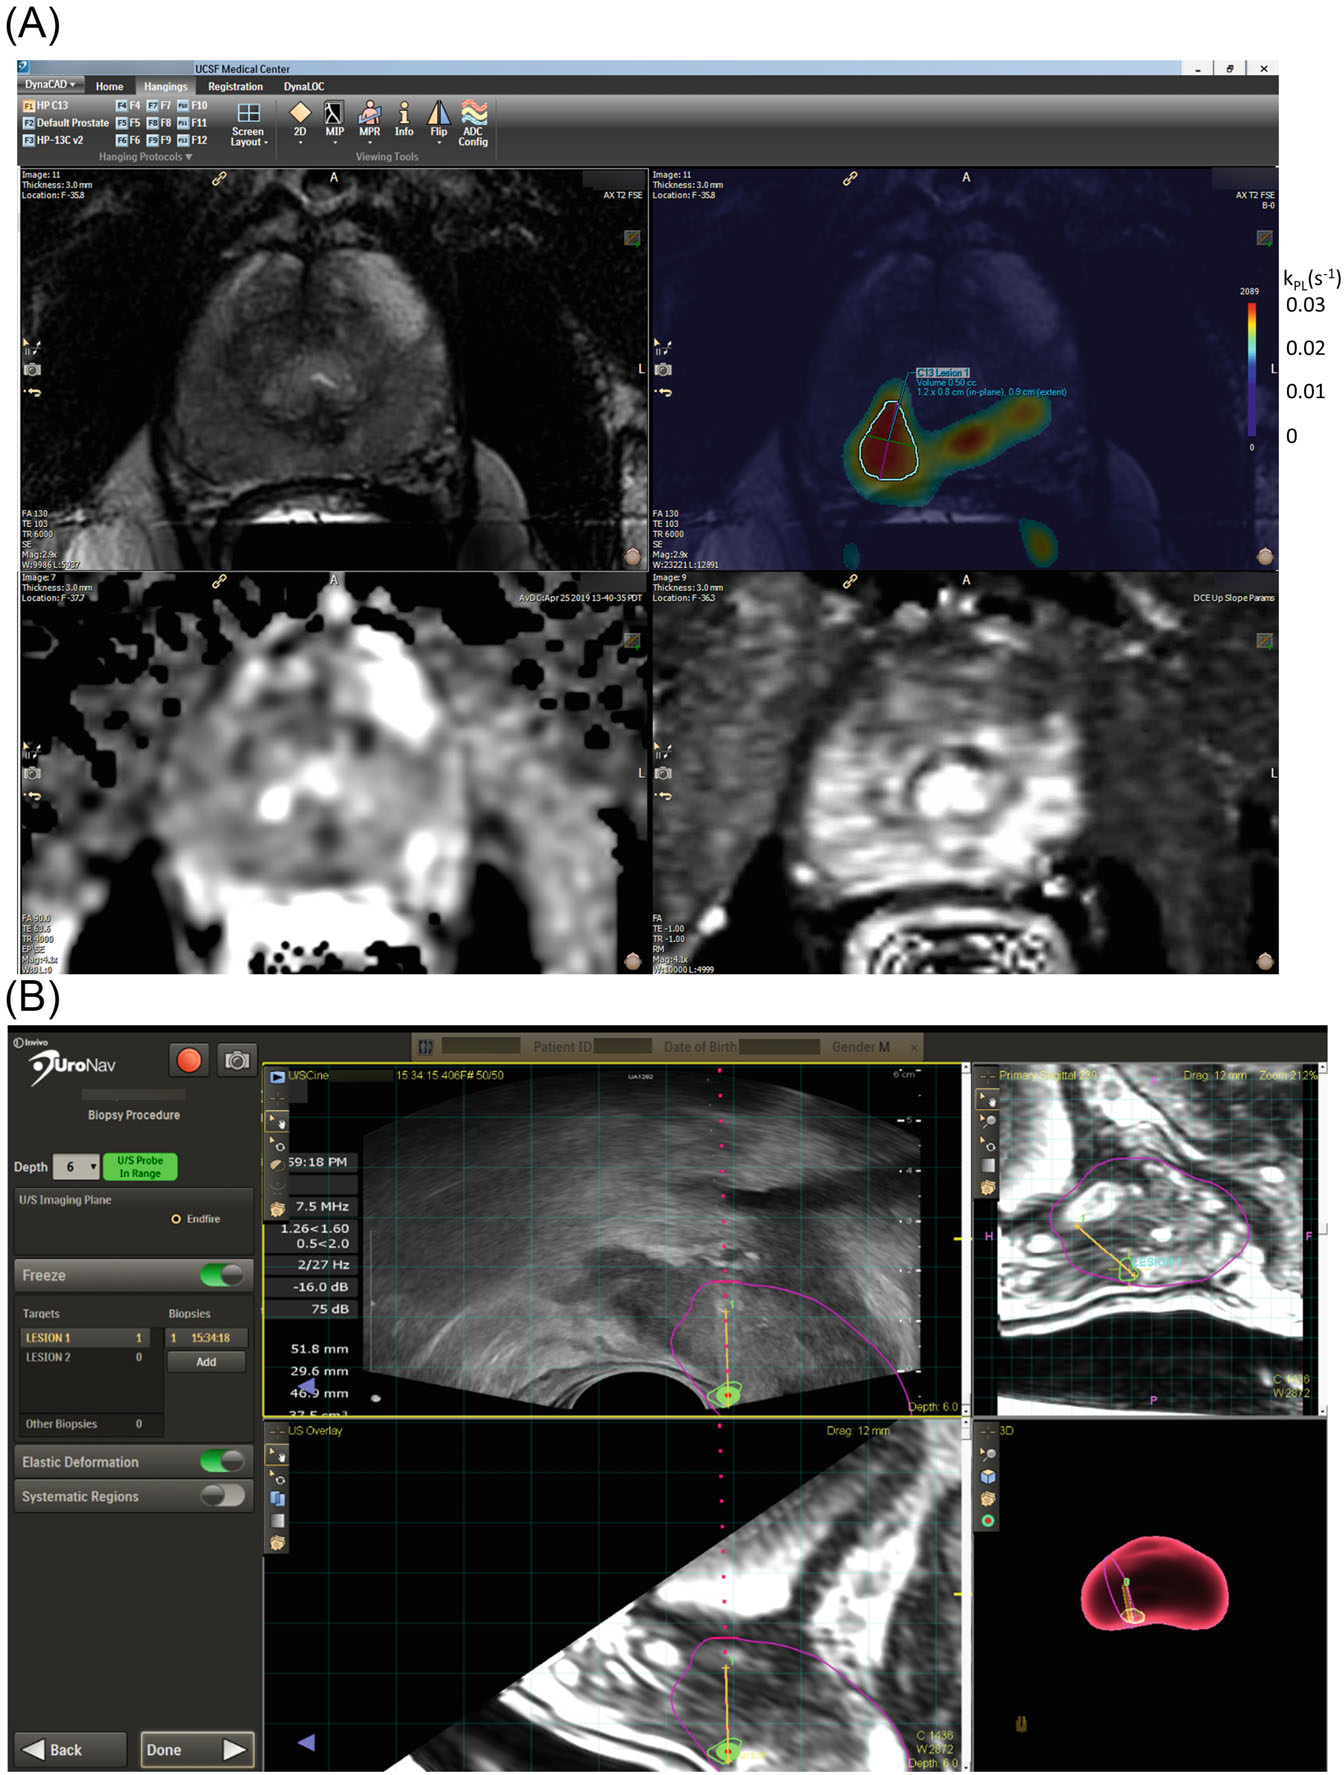
FIGURE 2.

(A) A representative targeting protocol using a commercial prostate biopsy targeting platform (Dynacad, Philips Invivo Corps.). This protocol can also be found in Supporting Information Video S1. The 3D kPL image series was named with the keyword “diffusion” to allow a fusion overlay, displaying kPL as a pseudocolor over T2-weighted series. The overlay was displayed side by side with T2, ADC, and DCE maps, enabling the radiologist to correlate between series and outline 3D ROI for both 1H PIRADS and 13C research biopsy targets. Whereas the recommended kPL threshold for identifying potentially high-grade 13C lesions was set to 0.02(s−1), the lowest value of the heatmap was set to 0.01 for display purposes. This is designed to provide radiologists context on the shape/size of the lesion. The corresponding kPL scales is shown next to the original color bar. (B) Both clinical and research targets are transferred to a commercial TRUS-fusion biopsy platform (UroNav, Philips Invivo Corps.), where the research biopsy targets were counted as systematic biopsies. The urologist sampled these targets under TRUS fusion guidance during a biopsy session, assisted by TRUS-MRI fusion (left panel: US axial, top right: MR sagittal) and 3D-rendered segmentation (bottom right panel) of the prostate. The biopsied tissues were submitted for histopathology analyses. 1H, proton; ROI, region of interest; TRUS, transrectal ultrasound.
