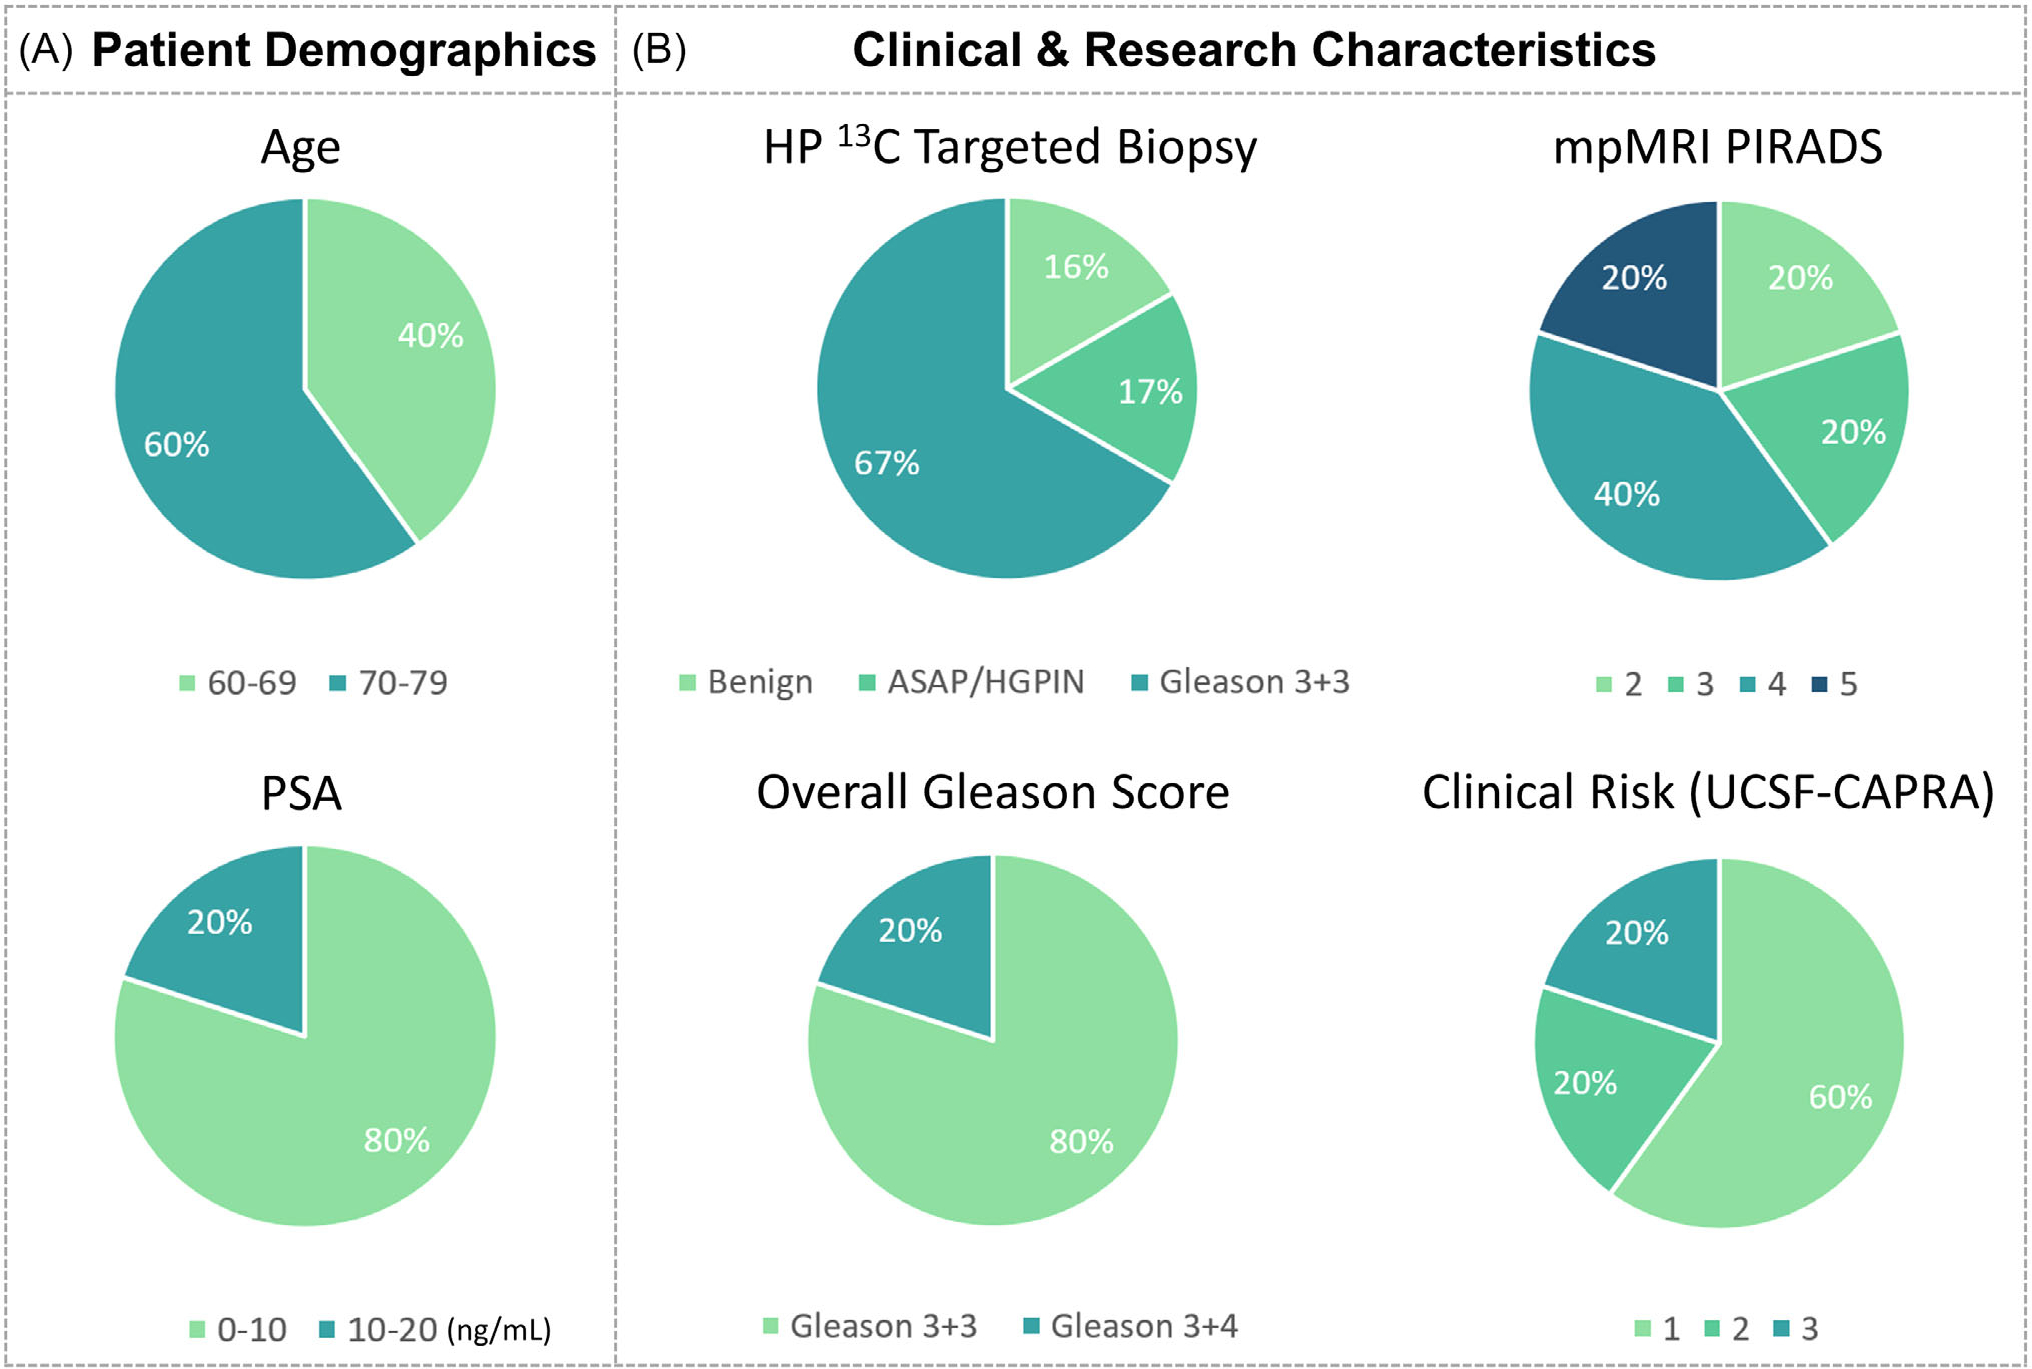
FIGURE 4.

(A) Pie chart summarizing the serum PSA and age of this initial cohort. (B) Pie chart summarizing the pathologic characteristics of the HP 13C research biopsies, PIRADS scores of 1H mpMRI biopsies, overall Gleason score, and clinical risk (CAPRA score). The Gleason 3+4 findings in patient 3 in the left midgland (contralateral to the 13C target) was small-volume (1 out of 4 cores in the sextant, <5% involvement per core) and only detected by systematic biopsy. The kPL value per lesion was calculated from the maximum voxel. CAPRA, Cancer of the Prostate Risk Assessment; PSA, prostate-specific antigen.
