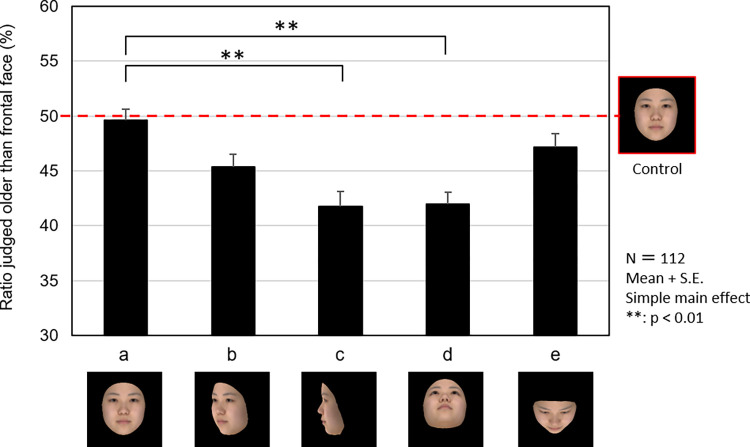
Fig 4. Effects of the facial orientation on age impression.
The graph shows the percentages of 112 observers who judged experimental stimuli (frontal face (a) and angled face (b, c, d, and e)) as older than control stimuli (frontal face). The closed columns and the vertical lines on the columns are the mean values and standard errors, respectively. The photographs show an averaged face of models in their 20s as an example.

