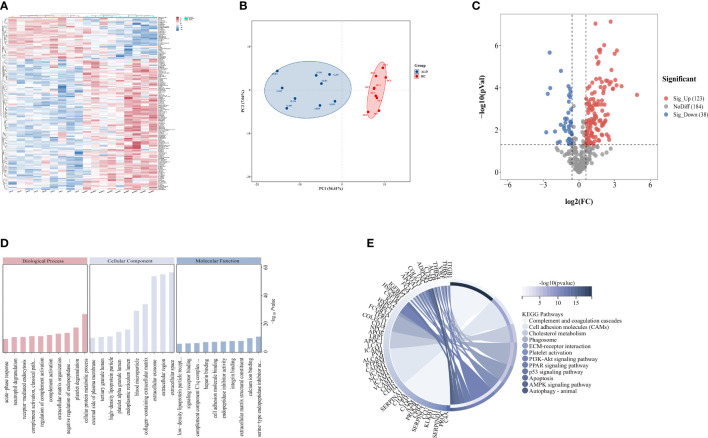
Figure 1.
Differential expressed proteins of clinical patients. (A) Heatmap represents gene expression trends in HC and ALD groups. (B) PCA shows two dimensionalities of HC and ALD groups according to differential proteins. (C) Volcano plot shows the identified proteins of HC and ALD groups distribution. (D) GO enrichment shows function and location of differential proteins. (E) KEGG enrichment shows the related pathways with P< 0.05.

