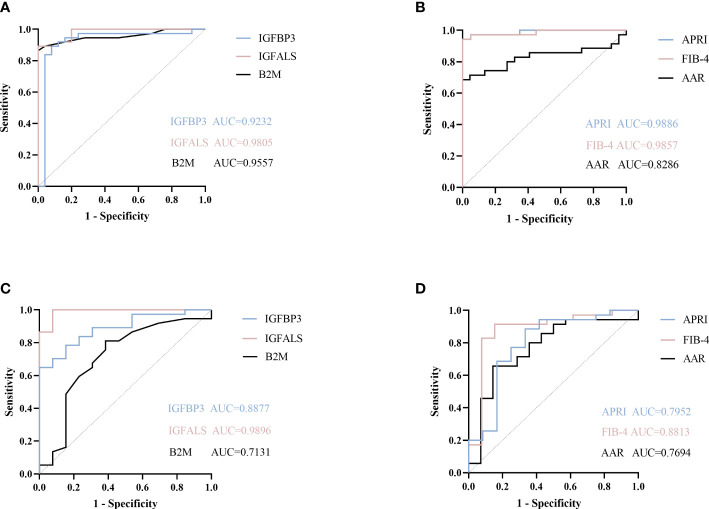
Figure 3.
ROC curve of potential proteins. (A) ROC curve of B2M, IGFBP3, and IGFALS to diagnose severe ALD from HC group. (B) ROC curve of APRI, FIB-4, AAR to diagnose severe ALD from HC group. (C) ROC curve of B2M, IGFBP3, and IGFALS to diagnose severe ALD from non-severe ALD group. (D) ROC curve of APRI, FIB-4, AAR to diagnose severe ALD from non-severe ALD group.

