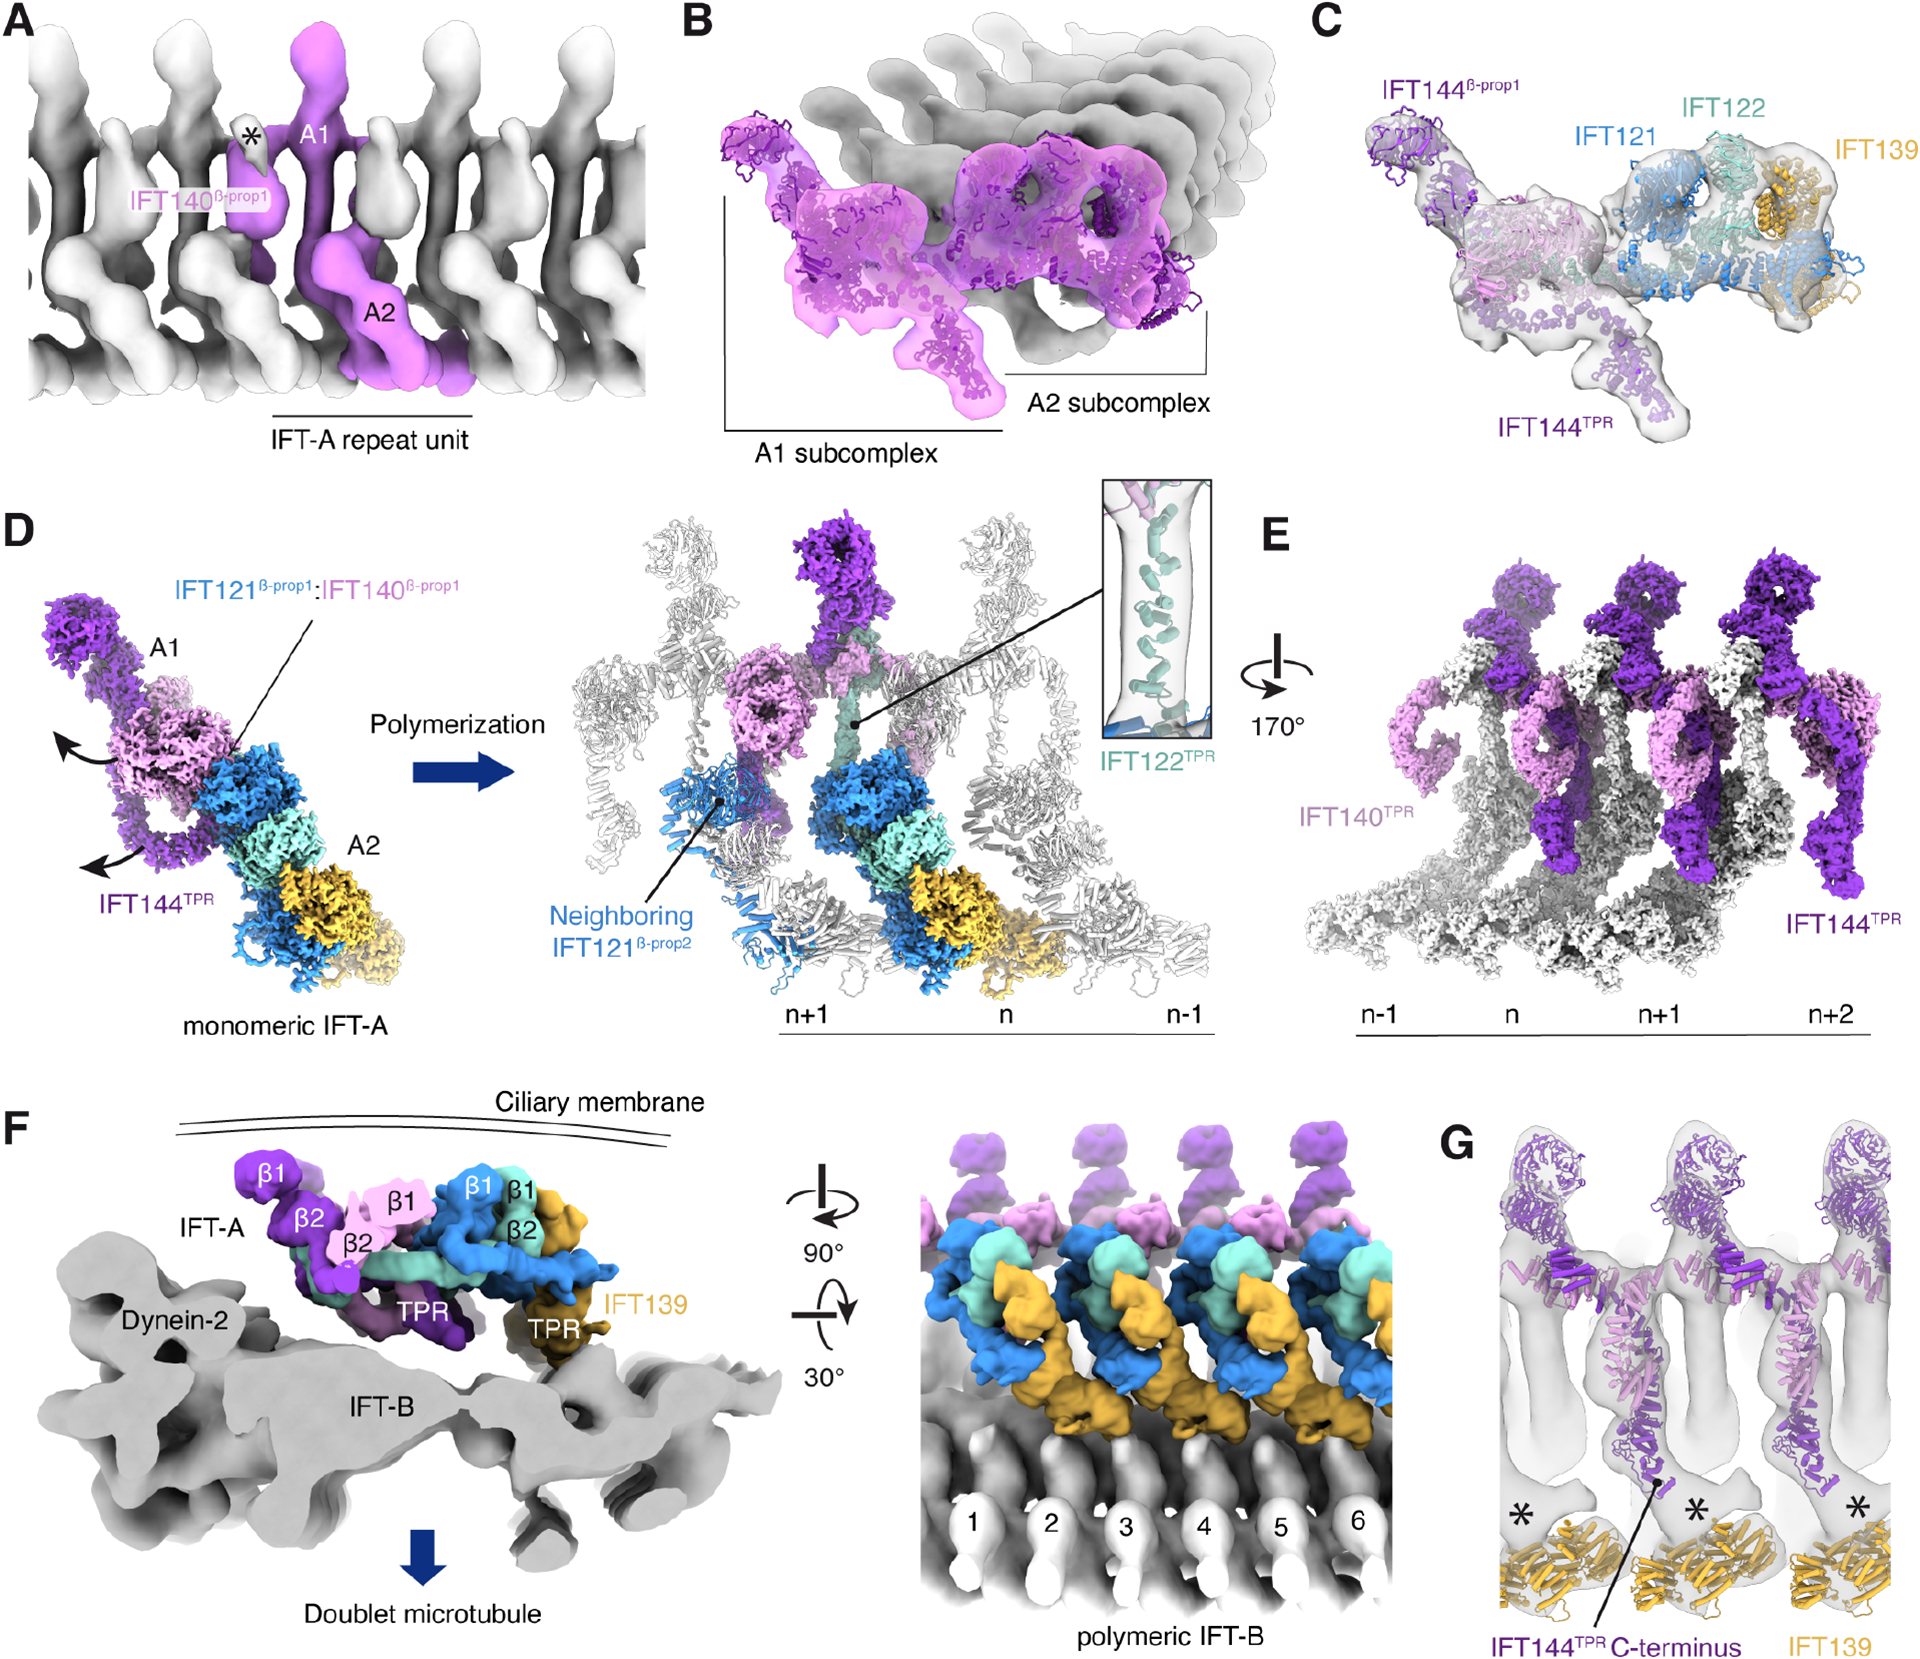
Figure 3. Organization of polymerized IFT-A in anterograde intraflagellar transport (IFT) trains.

A. A composite subtomogram average (generated by merging repeating copies of EMD-2679140) showing C. reinhardtii IFT-A polymerized on an anterograde IFT train and viewed from the ciliary membrane. The repeat unit corresponding to a single IFT-A monomer is colored pink. Additional density (marked with an asterisk) not accounted for by our model is observed above the IFT140β-prop1 domain.
B. View from the distal end of a train showing the atomic model of C. reinhardtii fit into the subtomogram average.
C. IFT-A, as in panel B, but with each subunit colored.
D. The A1 subcomplex reorients from its position in the monomeric complex. The arrows show the direction of movement. Rotation of the A1 subcomplex causes the IFT121β-prop1:IFT140β-prop1 interaction to break, and IFT140β-prop1 to interact with IFT121β-prop2 of the neighboring complex. IFT122TPR straightens in response to these subcomplex rearrangements (inset).
E. Arrangement of IFT140TPR and IFT144TPR on the underside of the IFT-A complex (viewed from IFT-B). IFT144TPR interacts with the neighboring molecule where it is bound by IFT140TPR.
F. Two views showing the position of IFT-A (in surface representation) relative to the subtomogram average of IFT-B (EMD-15261)18. IFT-A is predominantly tethered to IFT-B by the IFT139 subunit.
G. View of IFT-A from IFT-B showing atomic models of IFT139/140/144 (the other subunits are hidden for clarity). Additional density (marked with an asterisk) is seen between the C-terminus of IFT144TPR and IFT139.
