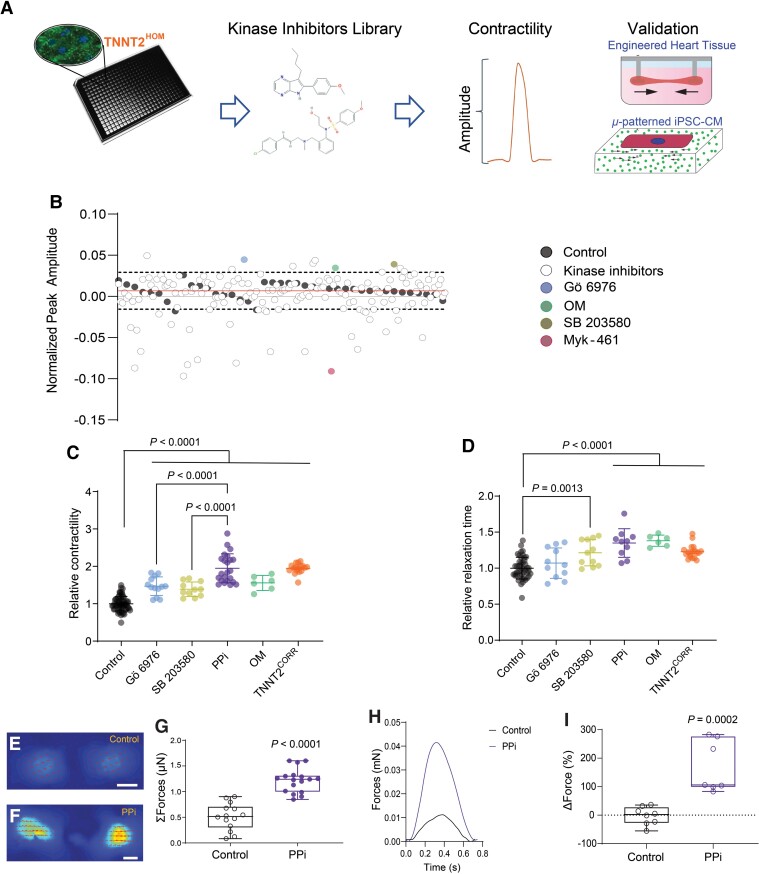
Figure 2.
High-throughput phenotypic drug screening in induced pluripotent stem cell-cardiomyocytes. (A) Schematic of high-throughput kinase inhibitor screen in dilated cardiomyopathy TNNT2HOM induced pluripotent stem cell-cardiomyocytes. Cells were plated in 384-well plates and treated with a chemical kinase inhibitor library (160 compounds), and contractility was measured with automated kinetic imaging. Hits were further validated in micropatterned single-cell induced pluripotent stem cell-cardiomyocytes and 3D-engineered heart tissues. (B) Kinase inhibitor screen scatter plot: peak amplitude is plotted on the y-axis against 160 corresponding kinase inhibitors on the x-axis. The dashed lines represent 2.5 SDs from the vehicle control mean (solid line). The two hit compounds identified (Gö 6976 and SB 203580) are indicated; and assay controls (OM and Myk-461) are also shown. The screen was performed in duplicate plates. (C) Relative contraction amplitude and (D) relaxation time of TNNT2HOM induced pluripotent stem cell-cardiomyocytes treated for 72 h with the two hit compounds, Gö 6976, SB 203580, alone, or in combination (PPi). For comparison, TNNT2HOM induced pluripotent stem cell-cardiomyocytes treated with OM, and untreated TNNT2CORR induced pluripotent stem cell-cardiomyocytes are shown. Mean ± standard deviation from three independent differentiation batches. (E and F) Representative vector motion maps of micropatterned TNNT2HOM induced pluripotent stem cell-cardiomyocytes treated with vehicle control (Control) or PPi for 72 h (scale bar = 20 μm) (n = 14 and 17, respectively). Two independent differentiation batches. (G) Total forces (ΣF) of micropatterned single TNNT2HOM induced pluripotent stem cell-cardiomyocytes. (H) Representative 3D-engineered heart tissues contractile force traces and (I) 3D-engineered heart tissues contraction force, relative to baseline (ΔForce) of each engineered heart tissue. Box-and-whisker plots show the minimum, the 25th percentile, the median, the 75th percentile, and the maximum from three independent differentiation batches.

