
Fig. 2.
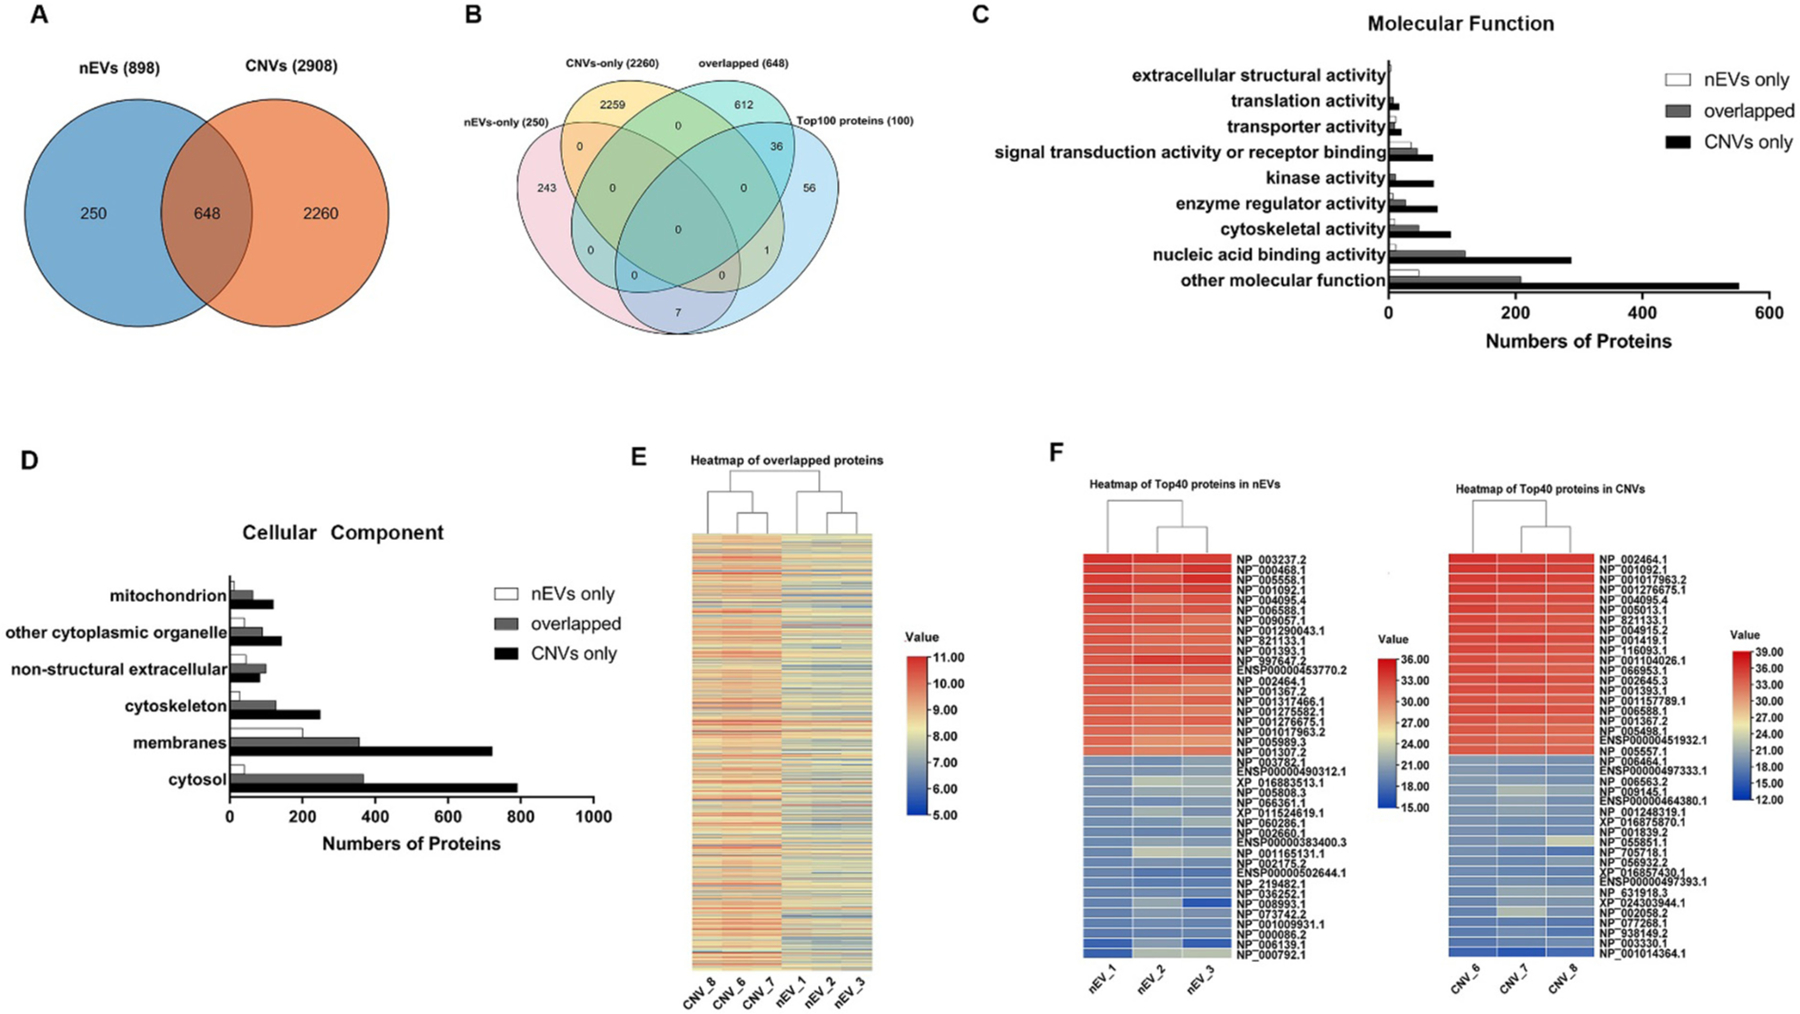
Protein profile of nEVs and CNVs derived from MDA-MB-231 cells detected by MS. (A) Venn diagram depicting the overlap of proteins, which were identified from the 3 biological replicates of nEVs and CNVs. (B) Venn diagram of mutual proteins, nEV-only proteins, CNV-only proteins, and top 100 proteins in Vesiclepedia database. (C) Molecular function of gene ontology (GO) enrichment analysis of proteins detected only in nEVs (white), only in CNVs (black), and in mutual proteins (gray). (D) Cellular component of gene ontology (GO) enrichment analysis of proteins detected only in nEVs (white), only in CNVs (black), and in mutual proteins (gray).(E) Heatmap showing the expression condition of overlapped 648 proteins detected in both nEVs and CNVs. The log10 expression values for overlapped proteins are indicated by colors as shown in the scale, with red indicating a high level of expression and blue, a low level of expression. (F) Heatmap of top 40 proteins within 3 biological replicates of nEVs (left) and CNVs (right). The log2 expression value for the top 40 proteins are indicated by colors as shown in the scale, with red indicating a high level of expression and blue, a low level of expression.