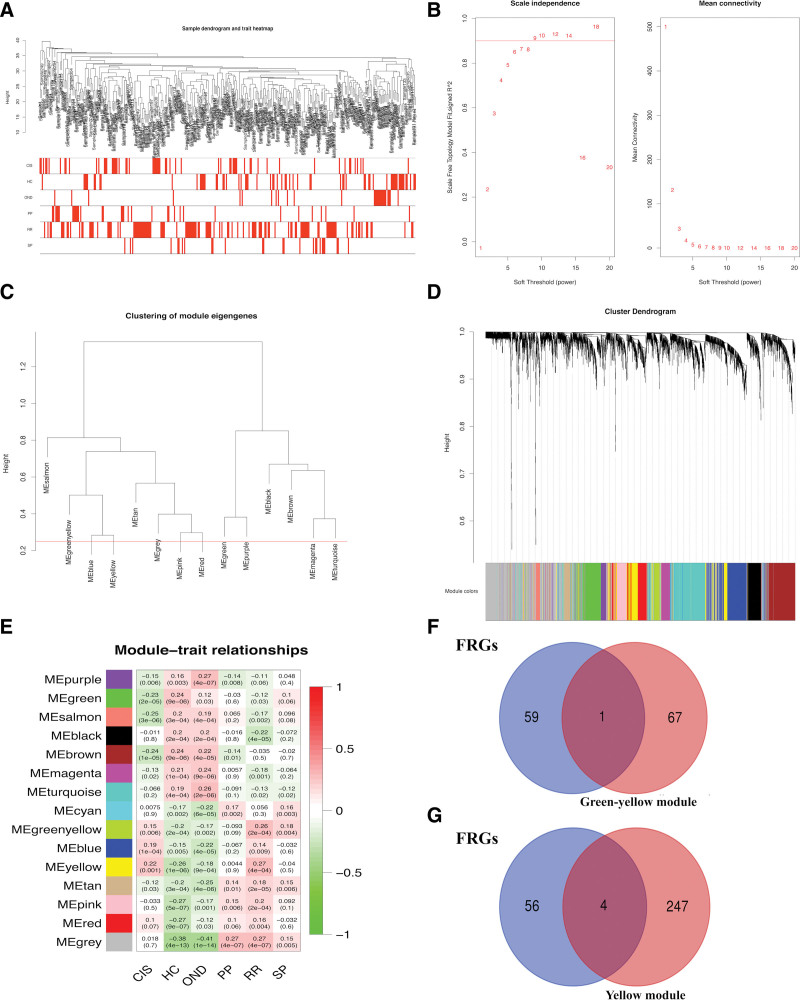
Figure 4.
Key module correlated with multiple sclerosis (MS) identified by weighted gene co-expression network analysis (WGCNA). (A) Clustering of samples to detect outliers. (B) Scale-free topology model (left) and mean connectivity (right) for finding the soft-thresholding power. The power selected is 6. (C) Clustering of all modules. The red line indicates the height cutoff (0.25). (D) Cluster dendrogram of genes. (E) Heatmap showed the relationships between different modules and clinical traits. (F) Venn diagram was used to pick up the intersection of green-yellow module genes and 60 FRGs. (G) Venn diagram was used to pick up the intersection of yellow module genes and 60 FRGs. FRG = ferroptosis-related gene, MS = multiple sclerosis, WGCNA = weighted gene co-expression network analysis.

